9,417
Views
143
CrossRef citations to date
0
Altmetric
Reviews

Microalgae for municipal wastewater nutrient remediation: mechanisms, reactors and outlook for tertiary treatment

, , , , &
Pages 133-148 | Received 08 Sep 2015, Accepted 03 Oct 2015, Published online: 03 Nov 2015

Figures & data

Figure 1. Schematic diagram of a microalgal cell summarising the biochemical pathways of nitrogen and phosphorus remediation, including indirect mechanisms (highlighted within a dashed box). © Represents co-transportation.

Figure 1. Schematic diagram of a microalgal cell summarising the biochemical pathways of nitrogen and phosphorus remediation, including indirect mechanisms (highlighted within a dashed box). © Represents co-transportation.

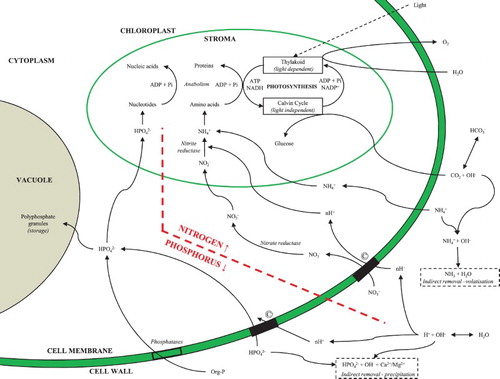
Table 1. Ammonium and phosphorus removal by microalgal cultures for varying waste streams.

Figure 2. Categories of microalgal bioreactors for wastewater remediation.

Figure 2. Categories of microalgal bioreactors for wastewater remediation.

Table 2. Summary of microalgal bioreactor designs, operating parameters and performance.

Figure 3. Influent concentration versus effluent concentration for (a) ammonium and (b) phosphate; and treatment period versus remediation efficiency for (c) ammonium and (d) phosphate for all bioreactors. HRAP (▪), biofilms (◊), matrix-immobilization (▴), PBR (○) and parity line (- -).

Figure 3. Influent concentration versus effluent concentration for (a) ammonium and (b) phosphate; and treatment period versus remediation efficiency for (c) ammonium and (d) phosphate for all bioreactors. HRAP (▪), biofilms (◊), matrix-immobilization (▴), PBR (○) and parity line (- -).
Supplemental material

Supplemental_Data.zip

Download Zip (81.2 KB)