Figures & data
Table 1. Primer sequences
Figure 1. The changes in body weight (a) and random blood glucose (b) during the generation of type 2 diabetic mice (n = 8-23/group). And the changes of RBG (c), serum TG (d) and LDL-C (e) in each groups after BAT transplantation (n = 5-8/group). *P < 0.05 vs Con; **P < 0.01 vs Con; ***P < 0.001 vs Con; +P < 0.05 vs DM-Con; +++P < 0.001 vs DM-Con
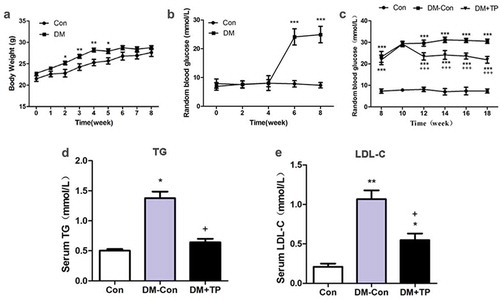
Figure 2. (a) Liver histologic changes in each groups. Representative images of hematoxylin-eosin (H&E) staining, Oil red O staining and Sirius Red staining. (Original magnification 200×). (b-d) The changes in mRNA expression of lipid synthesis, oxidative and fibrosis-related genes of liver in each group after BAT transplantation (n = 5-8/group). (b) Relative mRNA expression of liver FAS, CD36, Scd1 and ACCα. (c) Relative mRNA expression of liver NOX2, NOX4and Nrf2. (d) Relative mRNA expression of liver TGF-β1, FN and COL-1. (e-h) Representative Western blot showing TGF-β1, Nrf2, Nox4 and β-actin and densitometric analysis of Western results. *P < 0.05 vs Con; **P < 0.01 vs Con; +P < 0.05 vs DM-Con
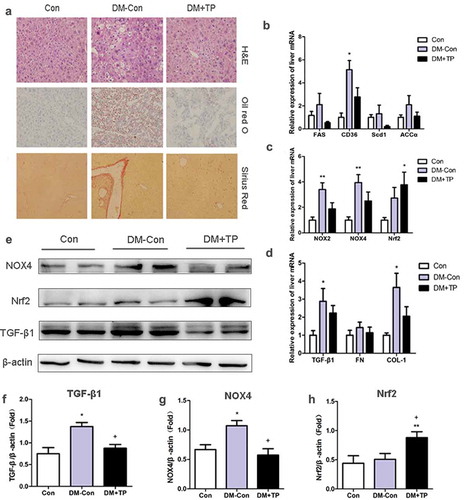
Figure 3. The changes in the expression of miR-99a in BAT (a), serum (b) and liver (c) in each group after BAT transplantation (n = 5–6/group). *P < 0.05 vs Con; +P < 0.05 vs DM-Con
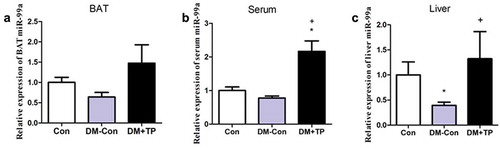
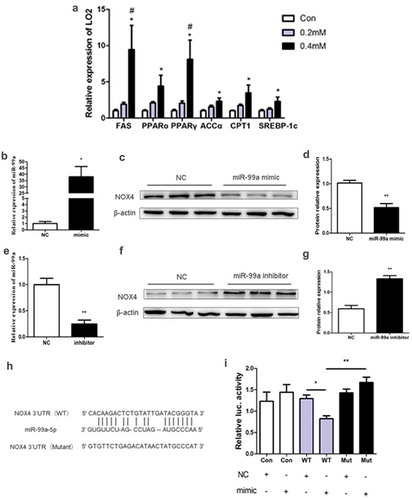
Figure 4. (a) Effects of different PA concentrations on mRNA expression of lipid metabolism-related gene in LO2 cells (n = 4/group). (b-d) The expression of miR-99a (b), NOX4 protein (c) and its quantitative analysis (d) in LO2 cells after transfected with miR-99a mimic (n = 3-4/group). (e-g) The expression of miR-99a (e), NOX4 protein (f) and its quantitative analysis (g) in LO2 cells after transfected with miR-99a inhibitor (n = 3-4/group). (h) Schematic diagram of binding sites of miR-99a-5p with NOX4 3ʹUTR. (i) Luciferase activity of LO2 cells after cotransfection with miR-99a mimic and pMIR-REPORT-NOX4 (n = 3-4/group). *P< 0.05; **P< 0.01. #P< 0.05 vs 0.2mM. WT: Wild-type; Mut: Mutant-type