Figures & data
Table 1. Gender-wise measured anthropometric, and biochemical parameters in both NGT, and T2D groups (expressed as means± S.D.)
Figure 1. DE genes showing association with various sub-types of lipodystrophy
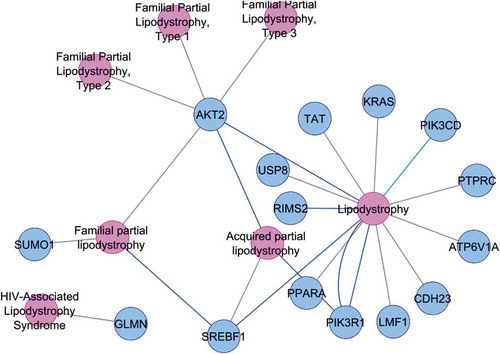
Figure 2. Interaction network of 135 lipodystrhophic-differentially expressed genes, prioritized by degree-centrality, and bottle-neck centrality
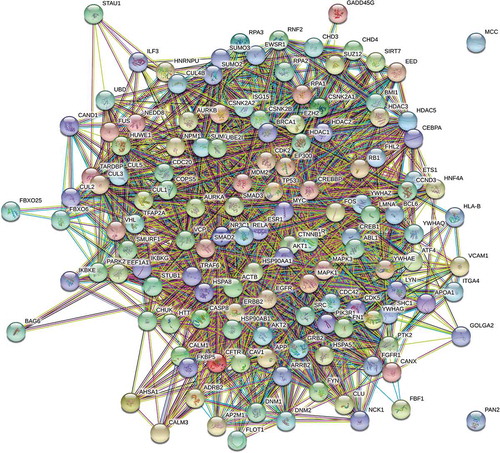
Table 2. Enriched pathways implicated by topologically prioritized genes
Figure 3. Results of WGCNA showing module – trait relationship between nondiabetic, and diabetic subjects. Correlations of traits with modules is shown by a colour-scale with green showing negative correlation and red, positive correlation
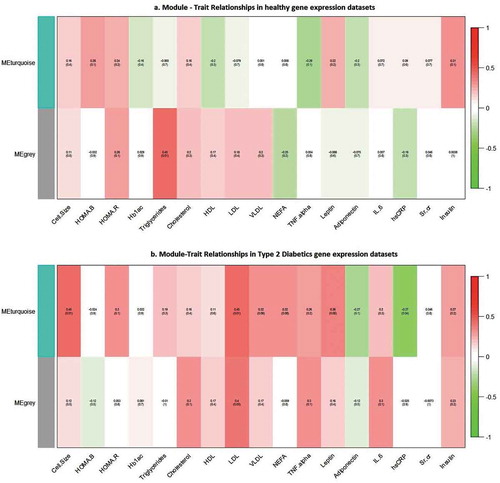
Table 3. List of up- and down-regulated lipodystrophic genes with ±2 fold expression differences from the average mean expression in the control group (see supplementary table S1 for full gene names)
Figure 4. Frequency of lipodystrophy genes in diabetic patients showing ±2 fold expression difference from the average mean expression in the control group
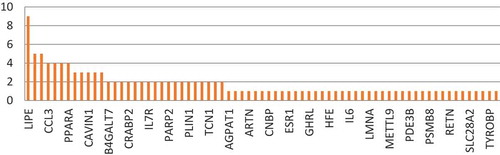
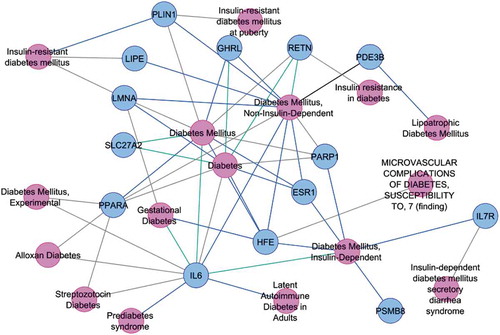
Figure 5. Associations of lipodystrophy genes (showing ±2 fold expression difference from the average mean expression in the control group) with Type 2 diabetes and its related phenotypes in diabetic patients