1,603
Views
2
CrossRef citations to date
0
Altmetric
Brief Report

Curated gene expression dataset of differentiating 3T3-L1 adipocytes under pharmacological and genetic perturbations

ORCID Icon, & ORCID Icon
Pages 600-608 | Received 01 May 2020, Accepted 22 Sep 2020, Published online: 04 Oct 2020

Figures & data

Figure 1. Diagram of the data curation and processing. Metadata were obtained from gene expression omnibus (GEO) and the original articles. Studies were examined and filtered for the details of complete experimental design. Sample information was curated using a unified language across studies. Probe intensities were obtained from GEO, mapped and collapsed to genes. Expression data were log2-transformed and normalized, and batch effects were removed. The curated metadata and the expression matrix were packaged in a R/Bioconductor experiment data package (curatedAdipoArray)

Figure 1. Diagram of the data curation and processing. Metadata were obtained from gene expression omnibus (GEO) and the original articles. Studies were examined and filtered for the details of complete experimental design. Sample information was curated using a unified language across studies. Probe intensities were obtained from GEO, mapped and collapsed to genes. Expression data were log2-transformed and normalized, and batch effects were removed. The curated metadata and the expression matrix were packaged in a R/Bioconductor experiment data package (curatedAdipoArray)

Figure 2. The experimental design of the curated datasets. A schematic description of the experimental design of the MDI-induced 3T3-L1 adipocytes under A) genetic or B) pharmacological perturbations. Each dataset is described by the target of the modification (right), the time point of intervention in hours (top) and the type of modification (▼, knockdown; ▲, overexpression; ● drug treatment). The time course was divided into four stages (0 and before, None; after 0 to 48, Early; after 48 to 144, Intermediate; after 144 hours, Late). Each dataset was represented by a separate colour (box) around the data points

Figure 2. The experimental design of the curated datasets. A schematic description of the experimental design of the MDI-induced 3T3-L1 adipocytes under A) genetic or B) pharmacological perturbations. Each dataset is described by the target of the modification (right), the time point of intervention in hours (top) and the type of modification (▼, knockdown; ▲, overexpression; ● drug treatment). The time course was divided into four stages (0 and before, None; after 0 to 48, Early; after 48 to 144, Intermediate; after 144 hours, Late). Each dataset was represented by a separate colour (box) around the data points

Table 1. Datasets of genetically modified adipocyte differentiation course. GEO, gene expression omnibus; Ref., reference

Table 2. Datasets of pharmacologically modified adipocyte differentiation course. GEO, gene expression omnibus; Ref., reference
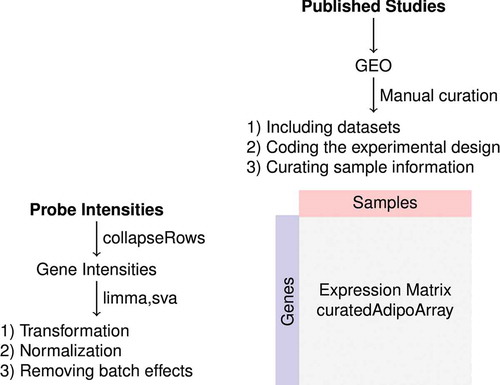
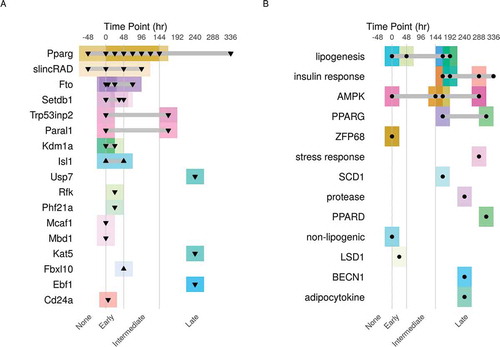
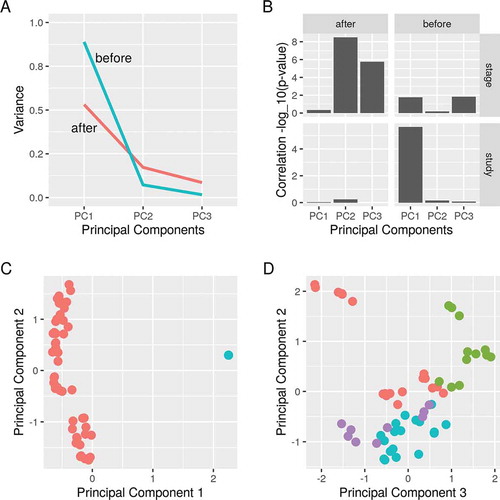
Figure 3. Principal component analysis of differentiating Pparg-knockdown 3T3-L1 pre-adipocytes. Principal component analysis was applied before and after removing batch effects. A) The amount of variance explained and B) the correlation of (study) and (stage) of differentiation with the first three components are shown before and after applying the procedure. C) The first and second principal components are shown. Samples are coloured by the study of origin (red, GSE12929; blue, GSE14004). D) The second and third principal components are shown. Samples are coloured by the stage of differentiation (red, none; green, early; blue, intermediate; magenta, late stage)

Figure 3. Principal component analysis of differentiating Pparg-knockdown 3T3-L1 pre-adipocytes. Principal component analysis was applied before and after removing batch effects. A) The amount of variance explained and B) the correlation of (study) and (stage) of differentiation with the first three components are shown before and after applying the procedure. C) The first and second principal components are shown. Samples are coloured by the study of origin (red, GSE12929; blue, GSE14004). D) The second and third principal components are shown. Samples are coloured by the stage of differentiation (red, none; green, early; blue, intermediate; magenta, late stage)

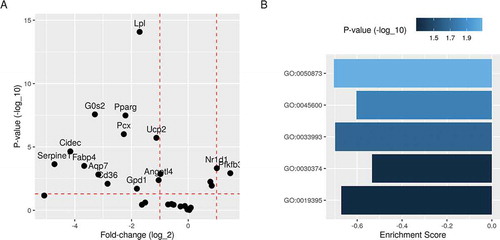
Figure 4. Differential expression and gene set enrichment analysis of differentiating Pparg-knockdown 3T3-L1 pre-adipocytes. Differential expression analysis was applied to the process data to identify regulated genes between Pparg-knockdown and control conditions. A) Fold-change (log2) and p-values (-log10) of previously identified PPARG target genes are shown. B) Differentially expressed genes were ranked by fold-change and used to calculate the enrichment score and p-values of relevant gene ontology terms. Brown fat cell differentiation (GO:0050873); positive regulation of fat cell differentiation (GO:0045600); response to lipid (GO:0033993); fatty acid oxidation (GO:0019395); nuclear receptor transcription coactivator activity (GO:0030374)

Figure 4. Differential expression and gene set enrichment analysis of differentiating Pparg-knockdown 3T3-L1 pre-adipocytes. Differential expression analysis was applied to the process data to identify regulated genes between Pparg-knockdown and control conditions. A) Fold-change (log2) and p-values (-log10) of previously identified PPARG target genes are shown. B) Differentially expressed genes were ranked by fold-change and used to calculate the enrichment score and p-values of relevant gene ontology terms. Brown fat cell differentiation (GO:0050873); positive regulation of fat cell differentiation (GO:0045600); response to lipid (GO:0033993); fatty acid oxidation (GO:0019395); nuclear receptor transcription coactivator activity (GO:0030374)