Figures & data
Table 1. Effects of Swertiamarin on Metabolic Parameters After 8 Weeks of Treatment
Figure 1. Swertiamarin reduces body weight and insulin resistance in high-fat diet-fed mice. (a) Body weights of the mice. (b) Tissue weights of the mice. (c) Blood glucose levels of the mice under ad libitum feeding conditions. (d) Plasma insulin levels of mice fasted for 16 h or under fed conditions. (e) Glucose tolerance test. (f) Insulin tolerance test. (g) Immunoblots of phosphorylated Ser473 Akt (p-Akt) and Akt in the eWAT and liver. Data are mean ± SEM, n = 5–6. *p < 0.05; **p < 0.01 vs. NC; #p < 0.05; ##p < 0.01 vs. HFD. NC, normal chow; HFD, high-fat diet; STM, swertiamarin; Epi, epididymal; Sub, subcutaneous; Retro, retroperitoneal; Mes, mesenteric; BAT, brown adipose tissue; GTT, glucose tolerance test; ITT, insulin tolerance test; eWAT, epididymal white adipose tissue
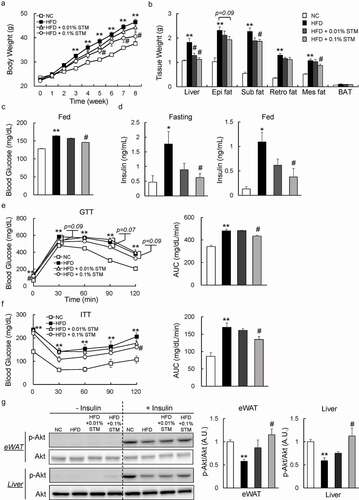
Figure 2. Swertiamarin attenuates HFD-induced adipocyte hypertrophy. (a) Representative H&E-stained eWAT sections. Scale bars = 100 μm. (b) Mean adipocyte size of mice. (c) Distribution of adipocyte size. (d) mRNA expression of lipogenic genes in eWAT. (e) mRNA expression of lipolytic genes in eWAT. (f) mRNA expression of adipokine genes in eWAT. Data are mean ± SEM, n = 5–6. *p < 0.05; **p < 0.01 vs. NC; #p < 0.05; ##p < 0.01 vs. HFD. (g) Oil Red O-stained 3T3-L1 adipocytes. (h) mRNA expression of lipogenic genes in 3T3-L1 adipocytes. Data are mean ± SEM, n = 5–6. *p < 0.05; **p < 0.01 vs. non-treatment (NT)
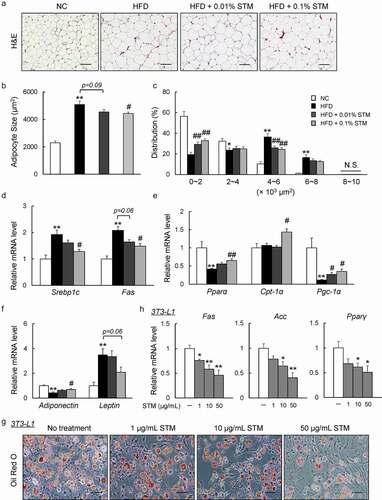
Figure 3. Swertiamarin ameliorates adipose tissue inflammation in HFD-fed mice. (a) Representative F4/80-immunostained eWAT sections. Scale bars = 100 and 50 μm. Arrows indicate crown-like structures. (b) mRNA expression of F4/80 and cytokine genes in eWAT. (c) mRNA expression of chemokine genes in eWAT. (d) Immunoblots of phosphorylated NF-κB p65 (p-NF-κB p65), phosphorylated p38 MAPK (p-p38 MAPK), and their total protein contents in eWAT. (e) mRNA expression of markers for M2 macrophages in eWAT. (f) mRNA expression of NADPH oxidase genes in eWAT. Data are mean ± SEM, n = 5–6. *p < 0.05; **p < 0.01 vs. NC; #p < 0.05; ##p < 0.01 vs. HFD
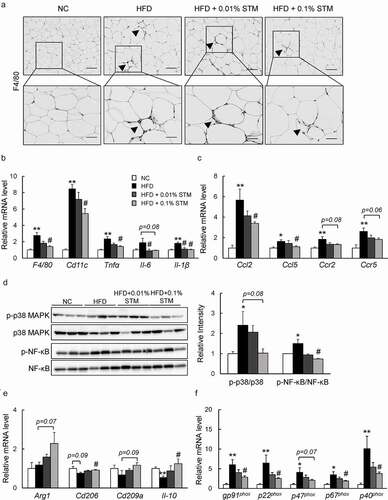
Figure 4. Swertiamarin directly suppresses inflammation in macrophages. (a) mRNA expression of lipopolysaccharide (LPS)-induced M1 markers in peritoneal macrophages. (b) mRNA expression of IL-4-induced M2 markers in peritoneal macrophages. (c) Reactive oxygen species (ROS) production in LPS-treated peritoneal macrophages. (d) mRNA expression of NADPH oxidase subunit genes in LPS-treated peritoneal macrophages. (e) Immunoblot op-p38MAPK, p-ERK, and p-NF-κB in LPS-treated Raw264.7 macrophages. n = 5–6. *p < 0.05; **p < 0.01, vs. non-treatment (NT). #p < 0.05; ##p < 0.01, vs. LPS- or IL4-treated cells
Figure 5. Swertiamarin alleviates HFD-induced hepatic steatosis in mice. (a) Representative H&E-stained liver sections. Scale bars = 100 μm. (b) Liver triglycerides (TG), total cholesterol (TC), and nonesterified fatty acid (NEFA) levels. (c) mRNA expression of lipogenic genes in the liver. (d) mRNA expression of β-oxidation genes in the liver. Data are mean ± SEM, n = 5–6. *p < 0.05; **p < 0.01 vs. NC; #p < 0.05; ##p < 0.01 vs. HFD
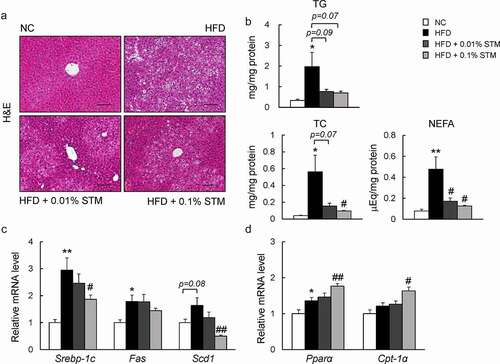
Figure 6. Swertiamarin prevents hepatic inflammation in HFD-fed mice. (a) Representative F4/80-immunostained liver sections. Scale bars = 100 and 50 μm. (b) mRNA expression of cytokine genes in the liver. (c) mRNA expression of chemokine genes in the liver. (d) Immunoblots of p-NF-κB p65, p-p38 MAPK, and their total protein contents in the liver. (e) mRNA expression of M2 macrophage markers in the liver. (f) mRNA expression of NADPH oxidase genes in the liver. Data are mean ± SEM, n = 5–6. *p < 0.05; **p < 0.01 vs. NC; #p < 0.05; ##p < 0.01 vs. HFD
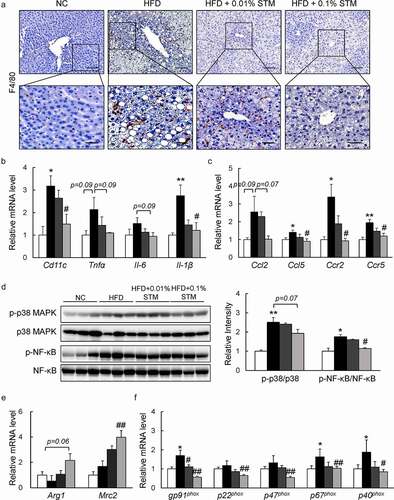
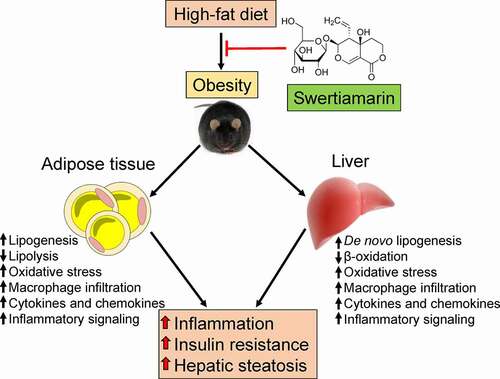
Figure 7. Putative role of swertiamarin in the amelioration of HFD-induced obesity. A high-fat diet induces obesity-related hepatic steatosis and insulin resistance by impairing lipid metabolism and increasing chronic inflammation within adipose tissue and the liver. Administering swertiamarin improves lipid metabolism, decreases cytokine and chemokine expression, and attenuates inflammatory signalling in the fat and liver, thus ameliorating obesity-related chronic inflammation and insulin resistance. HFD, high-fat diet