
Figures & data
Figure 1. Metformin inhibits adipogenesis in 3T3-L1 preadipocytes. (a) the schematic diagram of metformin intervention in 3T3-L1 adipocyte differentiation was shown. (b) 3T3-L1 cells were exposed to 0–100 mM of metformin for 48 h, and cell viability evaluated by MTT assay were shown. (c) Graphs of differentiated 3T3-L1 adipocytes stained by Oil Red O for various concentration of metformin treatment. Scale bar indicates 100 μm. (d) Quantitative PCR analysis of mRNA of the adipogenic genes PPARγ, C/EBPα, Scd1 and FABP4 in the process of metformin intervening adipogenesis. Statistical significance was calculated by using two-tailed Student’s t test for the effect of metformin on adipogenesis. *P < 0.05; **P < 0.01; *** P < 0.001.
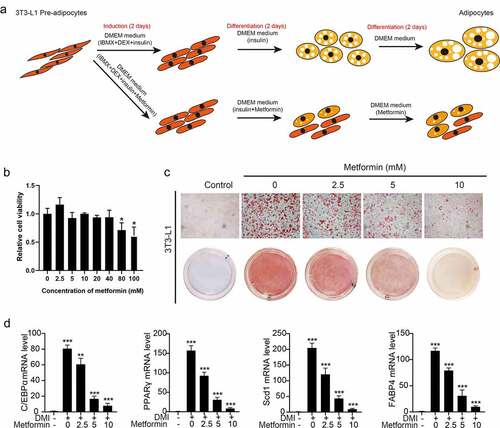
Figure 2. A number of differentially expressed genes in metformin inhibiting 3T3-L1 preadipocytes differentiation. (a) Principal Component Analysis (PCA) of three independent samples for control, DMI and DMI+ metformin groups. (b-c) Volcano plot for the Control vs DMI (b) and DMI vs DMI+ metformin. (d) A Venn diagram presents the number of DEGs that mediated metformin inhibiting adipognensis is unique or shared between adipogenesis-responsive genes and metformin-responsive genes. (e) Pearson correlation is shown between samples. (f) Heatmap of the DEGs in the three groups. Each row represents one gene, and each column represents one sample. Red indicates that the expression of genes is relatively up-regulated, and green indicates that the expression of genes is relatively down-regulated.
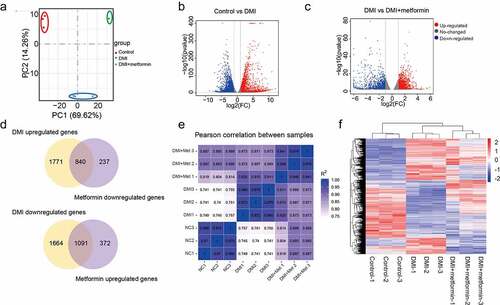
Figure 3. Gene ontology analysis of the adipogenesis-responsive and metformin-responsive genes. (a) GO enrichment analysis of adipogenesis-responsive genes. It showed the top 20 significantly enriched GO terms including biological process, cellular component, and molecular function. (b) The GO enrichment analysis of metformin-responsive genes as above indicative operation.
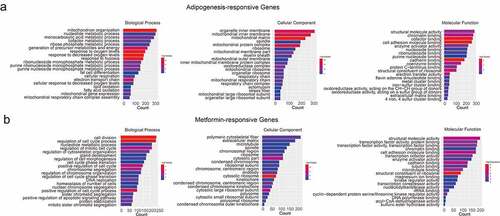
Figure 4. KEGG analysis of the adipogenesis-responsive and metformin-responsive genes. (a) KEGG analysis of the adipogenesis-responsive genes. It showed the top 20 significantly enriched KEGG pathways. The rich factor as the abscissa and the KEGG terms as the ordinate are plotted. (b) KEGG analysis of the metformin-responsive genes as above indicative operation.
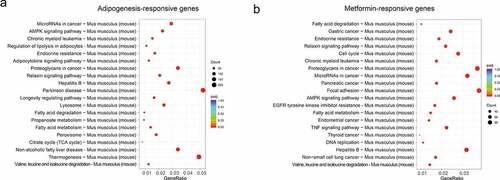
Figure 5. Identification of candidate genes associated with metformin inhibiting adipogenesis. (a-b) the screening and identification of upregulated genes (a) and downregulated genes (b) related to adipose differentiation by integrating the seven adipogenesis data set of GEO database. (c) A Venn diagram presented the number of DEGs that mediated metformin inhibiting adipogenesis was unique or shared (d) Heat maps show the 74 differentially expressed genes up-regulated or down-regulated by DMI and reversed by metformin after integrated analysis. (e) GO enrichment analysis of integrated DEGs. It showed the top 10 significantly enriched GO terms including biological process, cellular component, and molecular function. (f-g) KEGG analysis of integrated DEGs is shown.
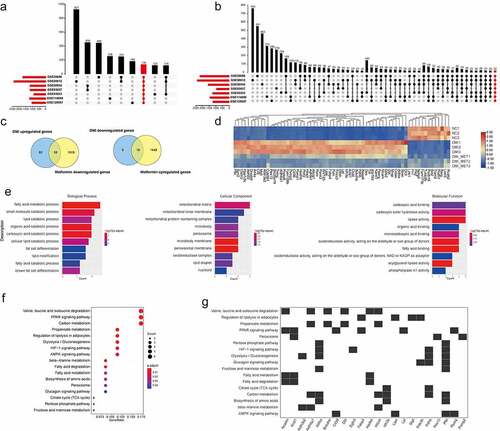
Table 1. Undifferentiated and differentiated 3T3-L1 cell samples from the NCBI Gene Expression Omnibus (GEO) database used in this study
Figure 6. Protein–Protein Interaction (PPI) and tissue expression profile analysis of integrated DEGs. (a) Using Cytoscape software, the PPI network was visualized (isolated nodes were removed). (b) Top 10 genes with the highest degrees in the PPI network. (c) Tissue expression heat maps of these candidate genes is demonstrated through the BioGps database.
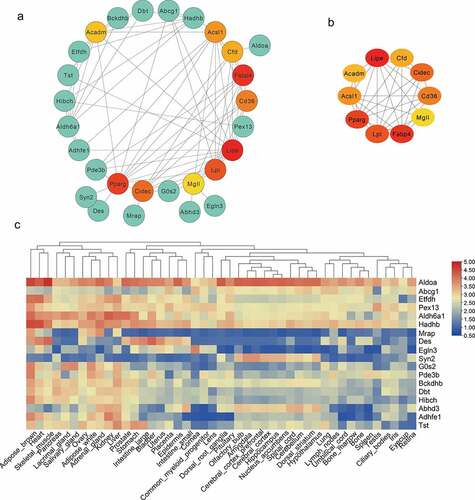
Figure 7. Validation and differential expression analysis of integrated DEGs in obese mice. (a) Graphs of differentiated 3T3-L1 adipocytes stained by Oil Red O for 5 mM metformin treatment. (b) The mRNA levels of integrated DEGs were assessed by real-time PCR as shown in A. (c-d) The expression difference of these genes were analysed in adipose tissue (c) and liver (d) of lean and ob/ob mice from the attie lab diabetes database. Statistical significance was calculated by using two-tailed Student’s t test for the effect of metformin on adipogenesis. *P < 0.05; **P < 0.01; *** P < 0.001.
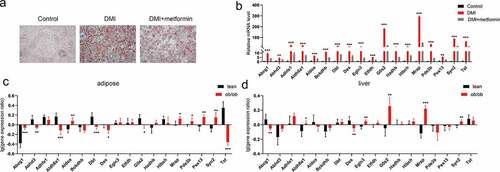
Table 2. Sequence of gene primers for fluorescent quantitative PCR
Data Availability Statement
The datasets presented in this study can be found in the Gene Expression Omnibus. The names of the repository is ‘Next Generation Sequencing Facilitates Quantitative Analysis of metformin on adipogenesis Transcriptomes’, the accession number is GSE179531. https://www.ncbi.nlm.nih.gov/geo/query/acc.cgi?acc=GSE179531