
Figures & data
Table 1. Demographic, metabolic, anthropometric and body composition markers
Figure 1. Circulating and transcript levels of inflammatory and adipose cytokines in elderly healthy and PLWH individuals with lipodystrophy, compared to healthy young controls. (a) Circulating levels of pro-inflammatory and metabolism-related cytokines in plasma from controls (n = 34), elderly (n = 28), and people living with HIV with lipodystrophy (PLWH-LD) (n = 60). (b) Proinflammatory and adipose metabolism-related mRNA levels in adipose tissue samples from the same three groups. The bars represent means ± SEM. Dotted line and grey bar represent mean ± SEM in healthy controls. (*p < 0.05, **p < 0.01, ***p < 0.001 compared with controls; #p < 0.05, ##p < 0.01 comparing PLWH-LD with elderly).
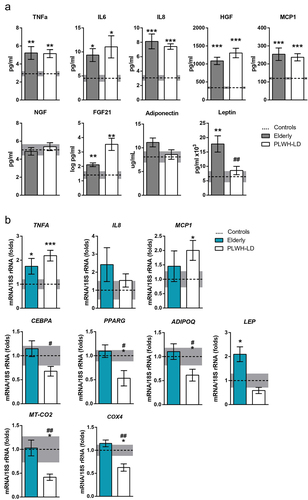
Figure 2. Senescence markers in elderly healthy and PLWH individuals with lipodystrophy, compared to healthy young controls. (a) mRNA levels of CDKN1A, CDKN2A, and MDM2 in adipose tissue samples from controls (n = 10), elderly (n = 12), and PLWH-LD (n = 18). (b) Representative image and quantification of P53 protein levels in control, elderly, and PLWH-LD adipose tissue samples (n = 3–4). C: Coomassie blue staining. (c) Telomere length measurements in adipose tissue samples from the same three groups, also including a subset of neonate samples (n = 5). The bars represent means ± SEM. Dotted line and grey bar represent mean ± SEM in healthy controls. (*p < 0.05, **p < 0.01 compared with controls).
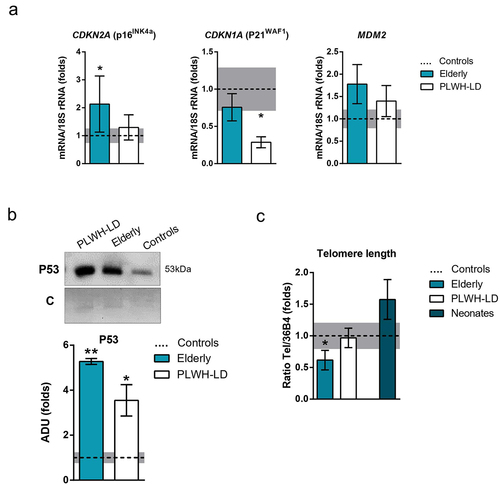
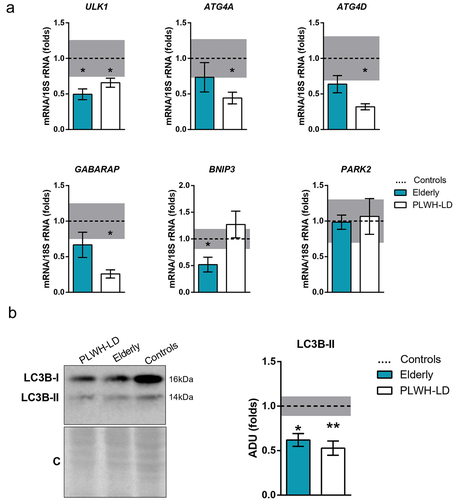
Figure 3. Autophagy markers in elderly healthy and PLWH individuals with lipodystrophy, compared to healthy young controls. (a) Gene expression levels of autophagy markers in adipose tissue samples from controls (n = 10), elderly (n = 12), and PLWH-LD (n = 18). (b) Representative image and quantification of LC3B-II protein levels in control, elderly, and PLWH-LD adipose tissue samples (n = 3–6). C: Coomassie blue staining. The bars represent means ± SEM. Dotted line and grey bar represent mean ± SEM in healthy controls. (*p < 0.05, **p < 0.01 compared with controls).
Supplemental Material
Download Zip (17.8 KB)Data availability statement
The data that support the findings of this study are openly available in Adipoplast website at https://adipoplast.org/datebase/