
Figures & data
Figure 1. Experimental methodology overview and data quality control. (a) Experimental outline of chromatin accessibility landscape construction during hASC adipogenesis. (b) The ATAC-seq signal enrichment around the TSSs for each sample. (c) The correlation of ATAC-seq peak reads between two replicates of each time point. (d) The fragment size distribution of ATAC-seq in each sample.
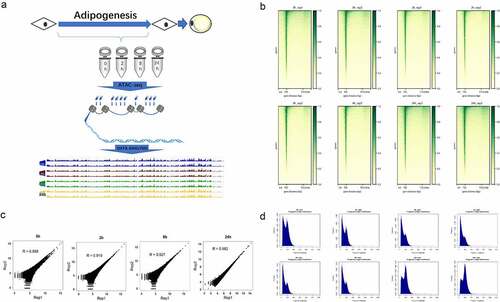
Figure 2. Overview of chromatin accessibility variation during hASC adipogenesis.
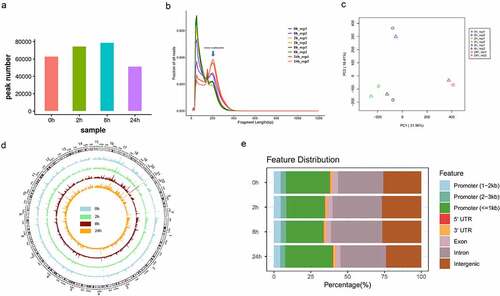
Figure 3. Dynamic temporal variation mode of chromatin accessibility during hASC adipogenesis. (a) Five dynamic accessibility behaviour modes of chromatin accessibility data analysis by c-means cluster during adipogenesis. (b) GO analysis of the regions in each cluster by GREAT.
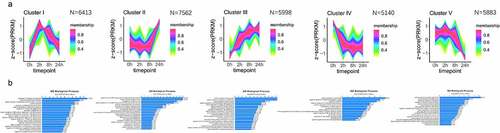
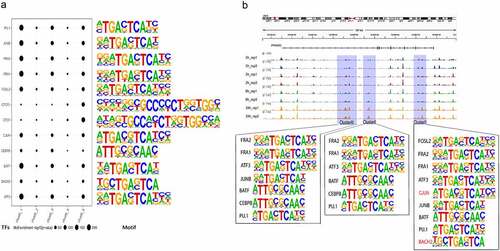
Figure 4. Rich TF binding motifs distribution at chromatin accessibility variation regions of PPARG locus during adipogenesis of hASCs. (a) Enrichment of TF binding motifs for the dynamical variation regions of chromatin during adipogenesis of hASCs. (b) TF binding motifs distribution of chromatin accessibility variation regions of PPARG locus.
Data Availability Statement
Datasets supporting the conclusions of this article are available in the GEO repository, accession number GSE180903(https://www.ncbi.nlm.nih.gov/geo/query/acc.cgi?acc=GSE180903). All data are available from the authors upon reasonable request.