
Figures & data
Figure 1. Solubility of ORO in different solvents. A: 15 ORO solutions show different degrees of red, representing different ORO dissolving abilities of 15 solvents. B. The absorbance at 492 nm of 15 ORO staining solutions semi-quantitatively reflects the solubility of ORO in different solvents. (n = 3. Error bars indicate mean ± SD. ns: p > 0.05, **P < 0.01; ****P < 0.0001, by ANOVA for multiple comparisons).
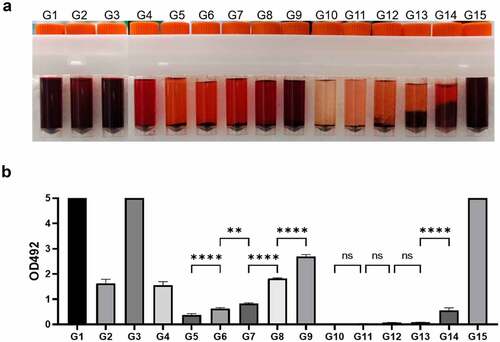
Figure 2. The staining effect of different dye solutions in different cells. A, C, E, G: Representative images of ORO staining for 143B human osteosarcoma cells (A), HSC-T6 rat hepatic stellate cells (C), APRE-19 human retinal epithelial cells (E), and adipocyte (G) adipocyte under the light microscope. Scale bars: 100 μm. B, D, F, H: The absorbance at 492 nm of ORO-containing extracts semi-quantitatively reflects the staining effect of 15 ORO staining solutions for 4 different cell lines. All the experiment was independently repeated three times. (n = 3. Error bars indicate mean ± SD. ns: p > 0.05, **P < 0.01; ***P < 0.001, ***P < 0.0001, by Student’s t-test between 2 groups comparisons).
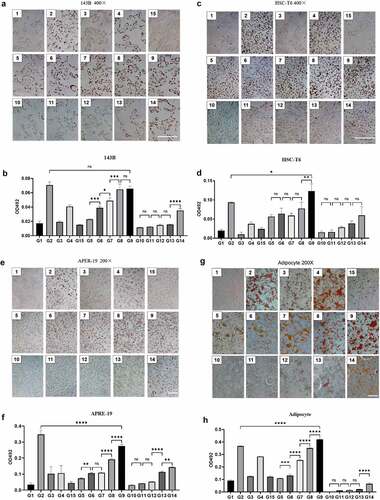
Figure 3. The staining effect of different dye solutions for different tissue sections. A: Representative images with 15 kinds of staining solutions for continuous liver sections under the light microscope. Scale bars: 100 μm. B: Further staining with staining solutions of groups (2), (5), (8), and (9) for the aortic arch, skin, and adipose tissue sections. Scale bars: 200 μm. C: Quantitative comparison of the staining effect of groups (2), (5), (8), and (9) for the liver, aortic arch, skin, and adipose tissue sections. Representative of 3 photographs for every solution group and the mean was estimated. (n = 3. Error bars indicate mean ± SD. ns: p > 0.05, *: p < 0.05; **P < 0.01; ***P < 0.001, by ANOVA for multiple comparisons).
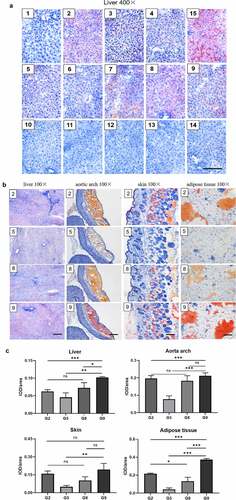
Table 1. Composition of different solvents for ORO preparation.
Supplemental Material
Download Zip (55.7 MB)Data availability statement
The authors confirm that the raw data supporting the findings of this study are available within the article (and/or) its supplementary materials which can be accessed online at https://doi.org/10.1080/21623945.2023.2179334