Figures & data
Table 1. Summary of sequencing output of TCR-α and TCR-β
Figure 1. Clonal diversity of regulatory T cells in FL tissue. (A) All TCRβ sequences were collected to show the individual Tregclonotypic diversity in 6 FL patients compared with 3 controls. Colors present clonal abundance in each subject by percentage of in-frame sequencing counts. The sum of proportions of the 5 most abundant TCRβ sequences is represented by percentage and compared between FL patients and controls using a two-tailed Student's t-test (P = 0.0238); n = clone number by identified TCRβ sequences (in-frame reads). (B) Simpson's Index of Diversity (SID; see text and equation in Materials and Methods) was used to measure Treg TCRβ sequence diversity between FL patients and controls (P = 0.0409).
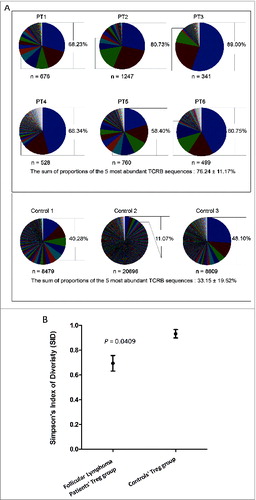
Figure 2. Treg localization in FL tissues. Immunohistochemical staining for Foxp3 (dark brown) was done on formalin-fixed, paraffin-embedded lymph nodes of 6 FL patients before treatment. Original magnification ×200. IF, intrafollicular; PE, perifollicular. *denotes 3 cases exhibiting prominent intrafollicular localization.
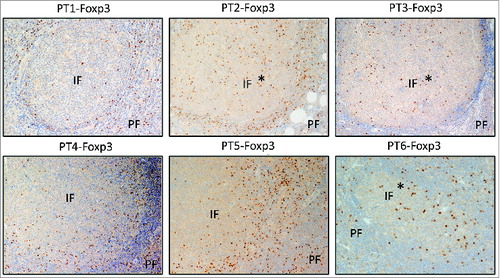
Figure 3. Localization of CD8+T cells and CD8+ TCR repertoire analysis in FL tissues. Immunohistochemical staining for CD8 (top) and TCRβ sequencing results of CD8+T cells (bottom) in pie chart pattern were combined to exhibit the correlation of CD8+ T-cell distribution and clonal diversity in 6 FL individuals. Colors display TCRβ sequences by sequencing counts with hierarchy; n = clone number by identified TCRβ sequences (in-frame reads). The detailed sequencing information of predominant clones in each data set is shown in Table S3. The average percentage of CD8+T cells is 10.47% ± 1.59% in total, with a standard error of 0.0065. Original magnification, ×200 for IHC pictures. IF, intrafollicular; PE, perifollicular.
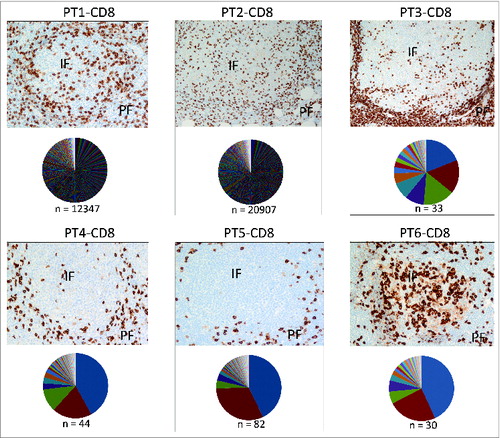
Figure 4. Correlation between CD8+TCR repertoire diversity and location in FL tissues. (A) The numbers of CD8+ T cells in perifollicular and intrafollicular areas were quantified, and the ratio of PF/IF (IF, intrafollicular; PE, perifollicular) cells was plotted along with the SID parameter. (B) The correlation between IRF4 gene expression and SID was assessed and displayed with a Spearman r of 0.08857 and P-value of 0.0333.
Figure 5. Localization of PD-1+T cells in the lymph nodes of these 6 subjects. Immunohistochemical staining for CD4, CD8, and PD-1 (dark brown) was done on formalin-fixed, paraffin-embedded lymph nodes of 6 FL patients before treatment. Original magnification, ×200 for IHC pictures.
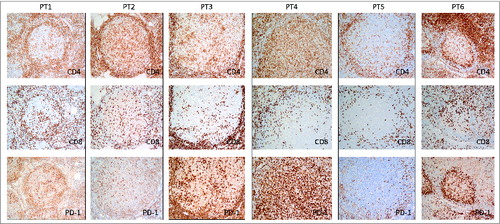
Figure 6. Inverse correlation of TCRβ diversity in CD8+ T cells and Treg cells. TCRβ diversity of T-cell subsets from individual subjects were quantified using SID.
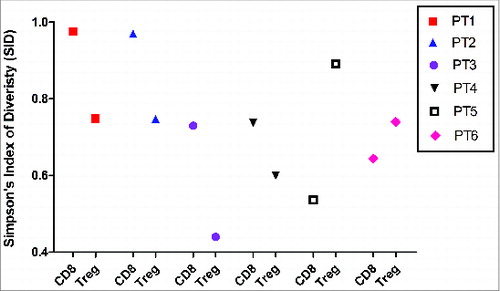
Table 2. Summary of characteristics of Treg and CD8+ T cells in 6 pretreatment FL patients
Figure 7. Public TCRβ chains and TCRα pairing. (A and B) Two public TCRβ sequences TRBV18/TRBJ1-1 with CDR3β of CASSPDVDTEKAFF and CASSPDVDTEAFF that were observed in patients 2, 4, and 6 (A) as well as every T-cell subset in 1 patient (Patient 4) (B) were selected to be paired with TCRα sequences by frequency. (A) Paired TCRα chains were represented by the sequences of the CDR3α region with percentage. (B) In Patient 4, 2 abundant common TCRβ sequences found among T-cell subsets are presented in pink color, whereas the different paired TCRα candidates are depicted by light green color bars with different patterns in order to exhibit their difference among T-cell subsets.
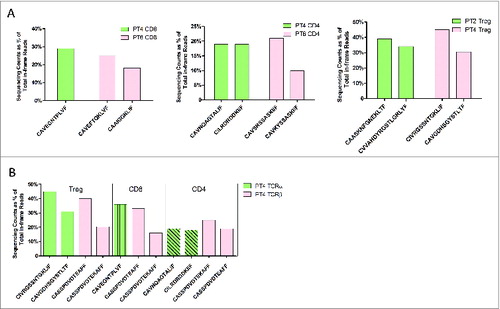
Table 3. Dominant and public TCRβ rearrangements among T-cell subpopulations and cases
Figure 8. Detected mutations in genes involved in antigen processing and presentation pathways. (A) Following whole exome sequencing, a short list of non-synonymous single-nucleotide variants (SNVs) in genes related to antigen processing and presentation identified in FL tissue from Patient 4 are shown with mutational frequency compared to that observed in nonmalignant cells. (B) A schematic diagram indicating the location of non-synonymous SNVs in exon 1 of HLA-DPB1 and exon 2 of HLA-C.
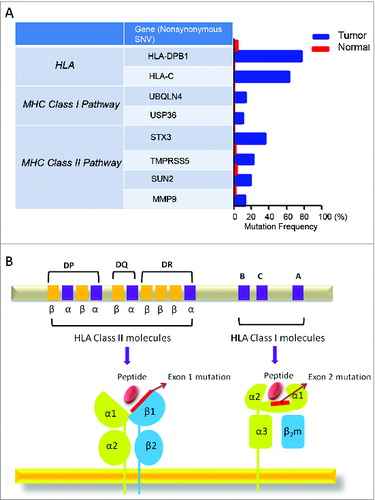
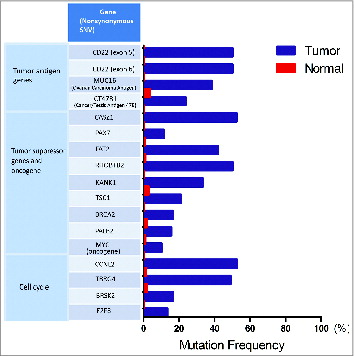
Figure 9. Other interesting mutations detected in Patient 4. A short list of nosynonymous single-nucleotide variants (SNVs) in genes related to tumor antigen, tumor suppressor, oncogene, and cell cycle are displayed with mutational frequency compared to that observed in nonmalignant cells.