Figures & data
Figure 1. Myeloid STAT3 promotes formation of CRCs. (A) Scheme of the AOM/DSS protocol for induction of CRCs. (B) Tumor multiplicity and mean tumor area of CRCs in male mice (n = 13 for STAT3wt and 16 for STAT3Δm). Bars represent data +/- SEM. (C) Histomorphometric quantitation of IHC stainings for cell proliferation (Ki67) and apoptosis (cleaved caspase 3) in CRCs. Bars represent data +/− SEM of n ≥ 9 tumors in ≥ 3 animals per genotype. (D) Assessment of blood vessel densities in the stroma of CRCs. IHC stainings for vWF-positive blood vessels (arrowheads in images) were used for quantitation. Bars represent data +/− SEM of n ≥ 9 tumors in ≥ 3 animals per genotype. Scale bar indicates 50 μm.
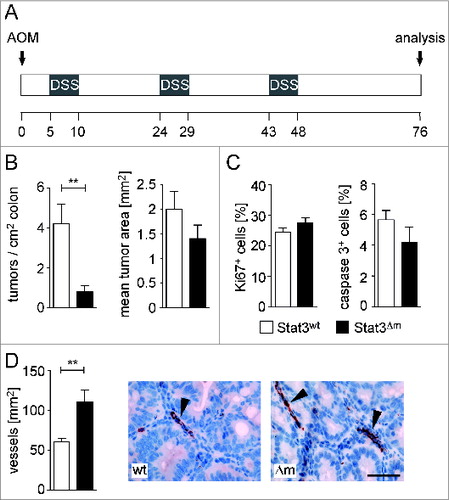
Figure 2. Enhanced stromalization of STAT3Δm tumors. (A) H&E staining (upper panel; T: tumor; S: stroma; scale bar indicates 100 μm) and double IHC for PDGFR/FSP1 (lower panel; scale bar indicates 50 μm) revealed increased stromal area in STAT3Δm tumors. FSP1+ fibroblasts are indicated by arrowheads. (B) IHC stainings with antibodies for indicated antigens were used for quantitative histomorphometry to define the composition of the tumor stroma. Bars represent data +/− SEM of n ≥ 9 tumors in ≥ 3 animals per genotype. (C) STAT3Δm tumors displayed reduced percentages of Arginase-1+ cells and increased percentages of iNOS+ cells. Bars represent data +/− SEM of n ≥ 9 tumors in ≥ 3 animals per genotype. (D) Histopathological grading of colon tumors revealed no significant change in STAT3Δm mice (l.g.: low grade; h.g.: high grade; n = 97 STAT3wt and 26 STAT3Δm tumors).
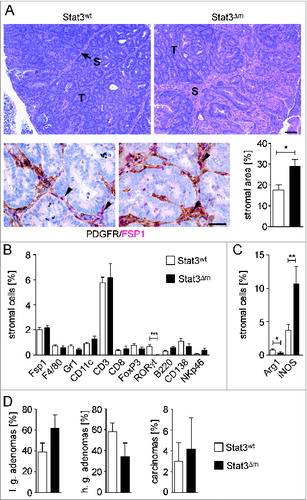
Figure 3. Tumor cytotoxicity of NK cells, isolated from spleens of STAT3wt and STAT3Δm mice, and development of CRCs in mice with reduced NK cell numbers. (A) Flow cytometric analysis of specific lysis of CFSE-labeled YAC-1 target cells by splenocytes from STAT3wt and STAT3Δm mice, injected with PBS or poly (I:C) (n = 3 per group). Different effector:target ratios are indicated. (B, C) Flow cytometric analysis of STAT3wt and STAT3Δm splenocytes demonstrating reduced percentage of CD3− NKp46+ gated Ly49D+ NK cells but increased mean fluorescence intensity (MFI) of NKG2D on CD3− NKp46+ gated NK cells in STAT3Δm mice (n ≥ 4 mice per genotype). (D) Tumor weight and tumor images after transplantation of BCR/ABLp185 tumor cells into STAT3wt and STAT3Δm host mice (n = 15 tumors in STAT3wt and 11 tumors in STAT3Δm mice). (E) STAT5ΔNK mice were employed as genetic model for NK ablation. The reduction of NK cell numbers in the intestine was confirmed by FACS analysis of mucosal cell preparations for CD45+ CD3− CD19− NKp46+ NK cells (left graph). Reduction of NK cell numbers did not affect tumor multiplicity and mean tumor area of AOM/DSS-induced CRCs (n = 8 STAT5fl/fl and 11 STAT5ΔNK mice). Bars represent data +/− SEM.
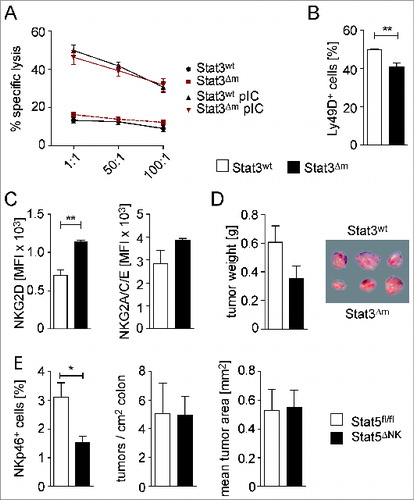
Figure 4. Characterization of cytotoxic T cell activity in STAT3Δm mice. (A) In vivo cytotoxicity assay in STAT3wt and STAT3Δm mice immunized with m-TRP2181-188. CFSElow target cells were used as internal control. CFSEhigh target cells were loaded with an irrelevant peptide or m-TRP2181–188 (relevant peptide). Specific killing was calculated after FACS analysis of CFSE-labeled target cells (n = 4 mice per group). (B) Tumor weight of transplanted MC38 tumor cells into STAT3wt and STAT3Δm mice (n = 12 tumors in STAT3wt and 14 tumors in STAT3Δm mice). (C) FACS analysis of immune cell preparations revealed increased numbers of CD4+ T cells, MDSCs (Gr1hi CD11b+) and reduced numbers of TAMs (Gr1lo CD11b+ CD11clo) in MC38 tumors of STAT3Δm hosts. Bars represent data +/– SEM. (D) Affymetrix RNA expression data of laser-capture microdissected stroma tissue from STAT3wt and STAT3Δm CRCs for genes indicative for T cell activation (left graph) and IL-2 receptors (right graph). (E) Affymetrix RNA expression data of ICR genes measured in the tumor stroma. (F) STAT1 protein expression and activation in the stroma of STAT3Δm CRCs. Images show IHC-stained tissue sections of stroma cells positive for phosphorylated (activated) pY-STAT1 (arrowheads). Scale bar indicates 50 μm. Corresponding IHC stainings were used for histomorphometric quantitation of STAT1- and pY-STAT1-positive cells in the tumor stroma (bar diagrams). Bars represent data +/− SEM of n ≥ 9 tumors in ≥ 3 animals per genotype.
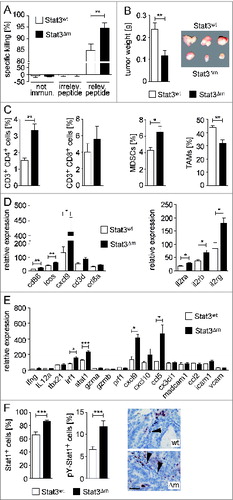
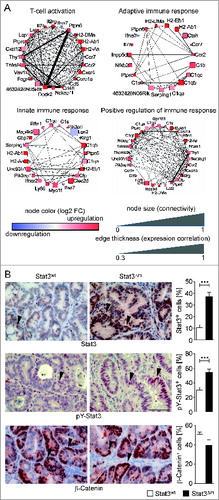
Figure 5. Weighted Gene Co-expression Network Analysis (WGCNA) of Affymetrix RNA expression data obtained with laser-capture microdissected stroma of STAT3wt and STAT3Δm CRCs. Modules of highly correlated genes were identified for immune response genes. (A) Selected network plots for GO terms in immune modules. Blue node color represents downregulation and red node color represents upregulation of gene expression in the stroma of STAT3Δm tumors. The node size is associated with the gene's co-expression in the entire data set. The edge (line) thickness is linked to the gene's connectivity (co-expression within the module). (B) Enhanced STAT3 expression and activation in STAT3Δm CRCs. IHC stainings for total STAT3, phosphorylated pY-STAT3 and ß-Catenin proteins were used for histomorphometric quantitation of positive tumor cells (arrowheads in images). Bars represent data +/− SEM of n ≥ 9 tumors in ≥ 3 animals per genotype. Scale bar indicates 50 μm.