
Figures & data
Figure 1. Accumulation of IL-10-producing CD4+FoxP3− T cells in liver tumors. PBMCs or MNCs isolated from tissues of HCC (n = 8–9) and LM-CRC (n = 5–14) patients were stimulated in vitro for 5 h with PMA/Ionomycin in the presence of protein transport inhibitors. IFNγ, TNFα, IL-13 and IL-10 were measured by intracellular staining by flow cytometry. (A) The percentages of cytokine-producing cells among total CD3+CD4+ T cells in blood, TFL and tumor. (B) IL-13 expression in viable tumor-derived CD3+CD4+IL-10+ T cells of HCC and LM-CRC patients stimulated with PMA/Ionomycin. FoxP3 and IL-10 expression in CD3+CD4+ T cells isolated from HCC (C) or LM-CRC tumors (D). (E) Frequencies of CD4+CD3+IL-13−FoxP3−IL-10+ T cells among CD4+ T cells. Red dots correspond to HCC and blue open dots are for LM-CRC (displayed as LMC in graphs). Values are means ± SEM, *p < 0.05, **p < 0.01, ***p< 0.001.
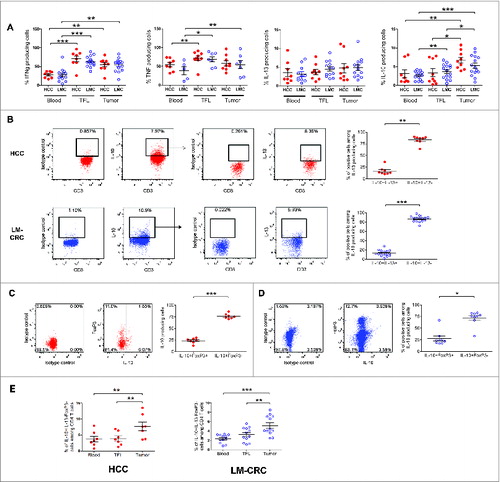
Figure 2. (See previous page). Tumor-infiltrating CD4+FoxP3−IL-10+ T cells are potent suppressors of T cell function and their phenotype corresponds to Tr1 cells. Tumor-infiltrating CD4+CD25− T cells were activated with anti-CD3/CD46 or anti-CD3/ICOS antibodies for 24–48 h, then stained for IL-10 and magnetically sorted into IL-10low and IL-10high fractions, which were both co-cultured at a 1:10 ratio with CFSE-labeled PBMCs from healthy donors stimulated with phytohemagglutinin (PHA) for 5 d (A) T cell proliferation and TNFα production measured by flow cytometry in PHA-stimulated PBMCs cultured alone or in the presence of IL-10low or IL-10high fractions of tumor infiltrating CD4+CD25− T cells. (B) Collective analysis of the percentages of suppression of T cell proliferation and TNFα production from eight patients. (C) Effect of blocking IL-10R on the suppressive capacity of CD4+IL-10high cells. Cells were cultured as described above in the presence of 30 μg/mL of neutralizing anti-IL-10R antibody or an irrelevant isotype control antibody. (D) Expression of CD49b and LAG-3 on tumor-infiltrating CD4+ T cells activated with antibodies to CD3 and ICOS for 24 h. Cells were gated on viable CD3+CD4+ T cells and FoxP3+CD127− Tregs were excluded from the analysis. Histograms show the expression of IL-10 and ICOS in different populations based on the expression of CD49b and LAG-3. (E) CD49b and LAG-3 expression in blood, TFL and TILs isolated from a representative patient with HCC. Cells were gated on viable CD3+CD4+FoxP3− T cells. (F) Collective percentages of CD49b+LAG-3+ cells within CD4+Foxp3− T cells in 21 patients analyzed (HCC n = 8 and LM-CRC n = 13). HCC (red dots) and LM-CRC (blue open dots).
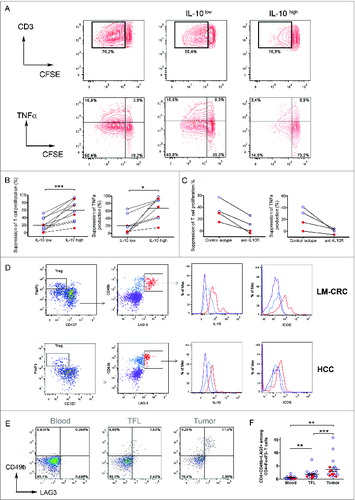
Figure 3. Plasmacytoid DCs are enriched at the tumor site and correlate with the frequencies of Tr1 cells. (A) Percentages of pDCs (CD123+HLA-DR+LIN-) among CD45+ leukocytes from paired samples of TFL and tumor tissue from 78 patients tested (HCC = 27 and LM-CRC = 51). Tumor leukocytes contain significantly higher numbers of pDCs than TFL (on the average 0.74 ± 0.6 % pDCs in HCC tumors and 1.01 ± 0.9 % in LM-CRC tumors, compared to 0.45 % and 0.75 ± 0.6 % in TFL, respectively). (B) Pearson correlation analysis between the frequencies of tumor-infiltrating pDCs and CD4+FoxP3−CD49b+LAG-3+ Tr1 cells in liver tumors (n = 15). Red dots are HCC and blue open dots represent LM-CRC. (C and D) Immunohistochemistry analysis shows co-localization of CD303+ pDCs (red brown) and LAG-3+ cells (blue) in LM-CRC (C) and HCC (D) tumors. Magnification 200x. An insert at higher magnification showing the close localization of CD303+ and Lag-3+ cells in HCC is displayed in D. (E) Expression of ICOSL and CD123 analyzed by flow cytometry in total cell suspensions from liver tumors.
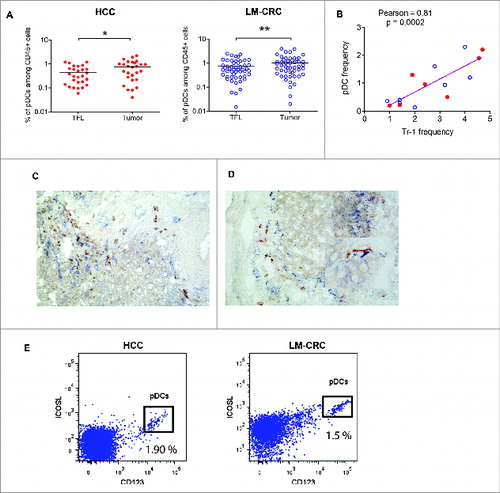
Figure 4. Tumor-derived pDCs induce the production of IL-10 by Tr1 cells through ICOS-ligand-ICOS signaling. (A) Blood pDCs isolated from healthy donors after overnight culture in the presence of lysates from TFL (TFLL-pDCs) or tumor tissue (TL-pDCs) were analyzed for the expression of ICOS-L. pDCs exposed to tissue lysates were used to stimulate autologous naive CD4+ T cells. The expression of IL-10 (B) and CD49b and Lag-3 (C) were analyzed on CD4+ T cells after co-culture with pDCs and re-stimulation with PMA/Ionomycin. IL-10 production was analyzed in CD3+CD4+FoxP3−CD49b+LAG-3+ T cells. To evaluate the impact of ICOS-ICOS-L signaling, cells were co-cultured in the presence of 50 ug/mL of control isotype antibody or anti-ICOS-L neutralizing antibody. Values are means ± SEM, *p < 0.05, **p < 0.01. Red dots represent HCC lysates and blue open dots LM-CRC lysates. (D) Pearson correlation analysis of the expression of ICOSL on pDCs cultured with medium, TFLL or TL, and the percentage of IL-10+ Tr1 cells detected after co-culture.
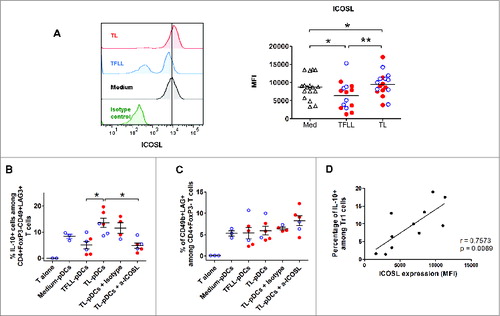
Table 1. Patient characteristics