
Figures & data
Figure 1. Expression of HLA-G and HLA-G-specific miRs in human tumor cell lines. (A) Detection and quantification of HLA-G mRNA. The HLA-G-specific PCR products and different splice variants could be detected in JEG-3, MZ2733RC and MZ2905RC according to Real and co-authors.Citation52 (B) Detection of HLA-G protein by Western blot analysis. Western blot analysis of selected cell lines were performed as described in Materials and Methods using the anti-HLA-G mAb MEM-G/4. Staining with the β-actin mAb served as loading control. The cell lines JEG-3 and MZ2733RC revealed HLA-G protein expression. (C) Heterogeneous expression of selected miRs in RCC cell lines. An inverse expression pattern of the HLA-G-specific miR candidates miR-152 and miR-148A and HLA-G protein was detected in the HLA-G+ cell lines JEG-3 and MZ2733RC. The HLA-G non-relevant miR-141 did not show an inverse expression pattern. (D) miR-148 family members were enriched and miR-133A only marginal enriched using the miTRAP assay as recently described.Citation34 The results are expressed in absolute copy number and as mean values of three. The HLA-G non-relevant miR-141 (present in the input control) could not be enriched.
Figure 2. Association of miR-152-mediated regulation of HLA-G expression with altered NK and LAK cell cytotoxicity (A) Characterization of the murine NIH/3T3 transfection system expressing human HLA-G (CDS and 3'-UTR) and miR-152 by Western Blot. (B & C) CD107a degranulation assay applying human NK cells (B) and LAK cells (C) as immune effector cells and a murine NIH/3T3-based transfection system expressing human HLA-G and miR-152 as target cells. The NIH/3T3 transfectants are lysed HLA-G dependent by the immune effector cells (E:T ratio is 10:1).
Figure 3. Inverse correlation of HLA-G and HLA-G relevant miR expression in RCC tumor lesions. (A) Representative immunohistochemical staining for a HLA-G− RCC lesion (sample II5, WHO grade: G2). (B) Representative immunohistochemical staining for a HLA-G+ RCC lesion (sample II39, WHO grade: G2). (C, D, E) Quantification of the expression of miR-148A (C), miR-152 (D) and miR-133A (E) by qPCR in 36 HLAG− and 36 HLA-G+ RCC lesions (listed in ), respectively. The absolute copy number determination is visualized as Box–Whisker plot. Statistical analyses were performed as described in Materials and Methods.
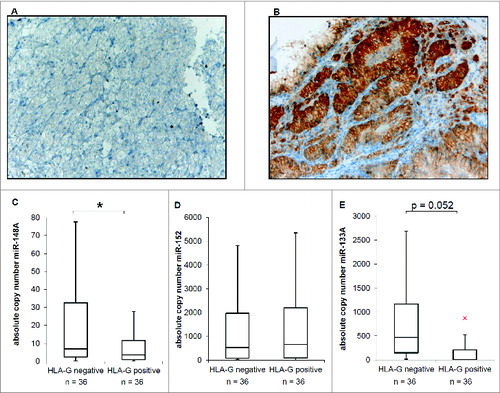
Table 1. Characteristics of the 72 RCC lesions (36 HLA-G− and 36 HLA-G+) analyzed for miR-148A, miR-152 and miR-133A
Table 3. Correlation of HLA-G expression with WHO grade
Figure 4. Immunohistochemical staining of tumor-infiltrating lymphocytes in RCC lesions (TMAs). (A) : Representative immunohistochemical staining of CD3+ and CD8+ TILs on a HLA-G− and HLA-G+ RCC lesion revealing statistical significant higher numbers of CD3+ and CD8+ T lymphocytes in HLA-G+ tumors. (B) Mean numbers of CD3+, CD8+, CD4+, CD56+ and CD69+ cells per field of view in 36 HLA-G− and 36 HLA-G+ RCC lesions (listed in ) visualized as Box–Whiskers-Blots. Only CD3+ (p < 0,001) and CD8+ (p < 0,001) TILs showed significant differences in the presence in the HLA-G+ and HLA-G− cohorts.
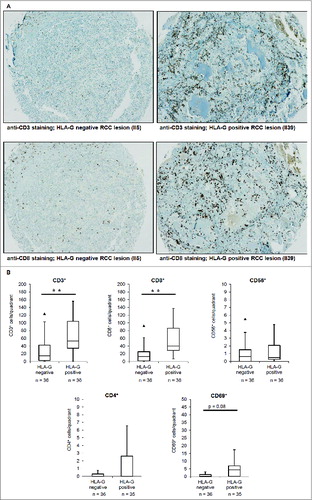
Figure 5. Correlation between the presence or absence of TILs and the HLA-G expression with disease-specific survival of the patients visualized as Kaplan–Meier-Plots. Kaplan–Meier-Plots of disease-specific survival in relation to HLA-G expression and tumor-infiltrating lymphocytes. The presence of CD4+ cells was associated (but not significant; p = 0.097) with better disease-specific survival. The markers HLA-G, CD3, CD8, CD56, CD4, FOXP3, CD 69 and CD 25 showed no significant correlation to disease-specific survival.
Table 4. Summary of the primer sequences and annealing temeratures
Table 2. Patients' and tumor characteristics