Figures & data
Figure 1. Baseline phosphorylation of STAT proteins, AKT and ERK in hematopoietic tumor cell lines and primary tumor cells. Representative examples of hematopoietic tumor cell lines or primary tumor cells analyzed for expression of several pSTAT proteins, pAKT and pERK at their basal level and after pre-treatment with a JAK inhibitor. Bar graphs indicate mean fluorescence intensity (MFI) expression determined by flow cytometry.
Figure 2. STAT1(pY701)activation after treatment with activated NK supernatant. Different hematopoietic tumor lines and primary tumor cells were treated with activated NK supernatant from primary NK cells stimulated with tumor cells and subsequently analyzed for expression of pSTATs, pAKT and pERK by flow cytometry. Levels of phosphorylation were measured before and after treatment with NK supernatant in cells pre-treated with 40 nm JAK inhibitor1. Bar graphs indicate mean fluorescence intensity (MFI) expression determined by flow cytometry.
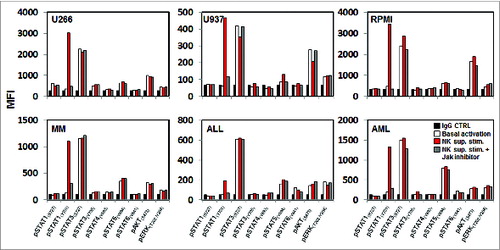
Figure 3. Effects of STAT1 knockdown in hematopoietic tumor cell lines. K562, KM12BM and IM-9 were stably transduced with two independent shRNAs targeting STAT1 and two irrelevant shRNAs as control. (A) The level of total STAT1 expression was evaluated by flow cytometry and (B) western blot analysis. Controls and STAT1-KO cell lines were incubated with primary purified NK effector cells pre-stimulated with 100 Units/mL IL-2 at 1:1 E/T ratio as described in Methods. (C) Levels of IFNγ secretion in culture supernatants, (D) percent NK cells expressing CD107a/b and (E) Killing of STAT1-KO and control cell lines mediated by fresh purified NK. Bars represent the specific lysis of target cells (mean ± SEM) of four different experiments (∗p < 0.05, ∗∗p < 0.01 compared to the isotype control with the highest reactivity).
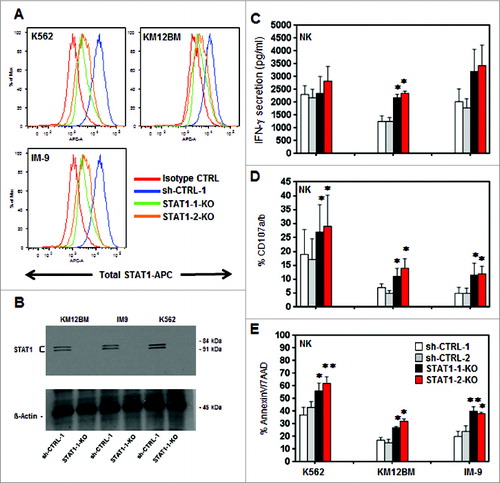
Figure 4. Effects of IFNγ-blocking antibody on tumor cell susceptibility to NK lysis. (A) Five hematopoietic tumor cell lines and (B) primary tumor cells were incubated with primary purified NK cells at 1:1 E/T ratio in the presence of an anti-IFNγ-blocking antibody (D9D10) or an isotype control. Bars represent the specific lysis of target cells (mean ± SEM) of four different experiments (∗p < 0.05, ∗∗p < 0.01 compared to the isotype control with the highest reactivity).
Figure 5. Tumor cell expression of PD-L1 and PD-L2 after incubation with activated NK supernatant or IFNγ. (A) Expression of PD-L1 in a representative example of AML cells treated with NK supernatant (left panel) or IFNγ (right panel) and with the addition of JAK inhibitor. (B) Expression of PD-L1 in hematopoietic tumor cell lines and primary tumor cells and expression of PD-L2 in U937 and primary AML cells. Surface antigen expression (MFI) is compared in cells incubated with medium alone, NK supernatant or IFNγ with or without JAK inhibitor. (C) Expression of PD-L1 in K562 or K562-STAT1-KO cells treated with NK supernatant (left panel) or IFNγ (right panel). (D) Expression of PD-L1 in 3 STAT1-KO or sh-CTRL cell lines. PD-L1 expression (MFI) is compared in cells incubated with medium alone, NK-supernatant or IFNγ.
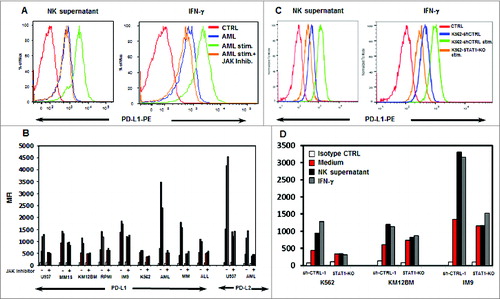
Figure 6. Effect of blocking PD-L1 on NK cell lysis of tumor cells. Tumor cell lines and primary tumor cells were incubated with (A) primary purified NK cells or (B) NK-92 at 1:1 E/T ratio with or without 10 μg/mL PDL1 antibody, JAK inhibitor or JAK inhibitor + PD-L1 antibody. The percentage of AnnexinV/7AAD positive cells was calculated for gated target cells (NKG2A or CD56 negative). Bars represent specific percent target cell killing (mean ± SEM) obtained in three separate experiments (∗p < 0.05, ∗∗p < 0.01 compared to target cells without PD-L1 antibody or JAK inhibitor treatment).
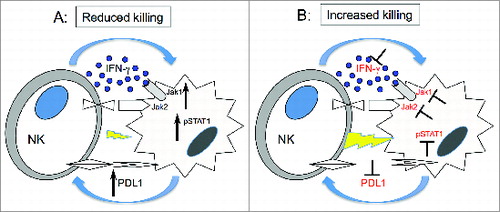
Figure 7. Hypothetical mechanism forIFNγ pathway modulation of tumor susceptibility to NK cells. (A) Upon engagement with target cells, NK cells secrete IFNγ, which in turn activates JAK1, JAK2 and STAT1 in tumor cells. This signal upregulates expression of PD-L1 on tumor cells resulting in increased resistance to NK cell killing. (B) Inhibition of JAK1 or JAK2 activation or IFNγ blocks upregulation of PD-L1 resulting in increased susceptibility of tumor cells to NK cell lysis.