Figures & data
Figure 1. Study design, tumor growth and survival after RMS challenge and therapy. (A) NSG mice (4–6 weeks old) were sublethally irradiated and humanized with CD34+CD3− grafts. Fully engrafted mice were inoculated with 1 × 10⁶ A204 cells at week 12. Immunotherapy began 18 d later when tumor volume reached 50–200 mm3. Mice were sacrificed after 5 weeks of treatment, when tumors of the FcIL-7 cohort had reached 20% of body weight. Four mice of the NHS-IL12/FcIL-7 and the NHS-IL12/IL-2MAB602 cohort were kept alive and treated at least until day 95 after tumor inoculation. (B) Effect of FcIL-7, NHS-IL12/FcIL-7, and NHS-IL12/IL-2MAB602 on survival. Survival curves were compared using log-rank test. Survival was highly significantly better for NHS-IL12 cohorts compared to FcIL-7 cohort. In the FcIL-7 control group, 4 animals died before day 52 and 3 were sacrificed on day 52 because of excessive tumor growth. In the NHS-IL12/FcIL-7 treatment cohort 2 mice died before day 52, 1 on day 56, and 1 on day 74 in the long-term treatment group. (C) Effect of FcIL-7, NHS-IL12/FcIL-7, and NHS-IL12/IL-2MAB602 on tumor growth. Mice bearing human RMS A204 were treated weekly with 20 µg FcIL-7 administered intravenously (rectangle), 20 µg NHS-IL12 ανδ 20 µg FcIL-7 (circle), or with 20 µg NHS-IL12 and 1.5 µg IL-2 complexed with 15 µg MAB602 (cross). Tumor sizes in mm3 are given as mean ± SD of 7 mice/group with short-term treatment (5 weeks). (D) Individual tumor sizes of 4 mice per NHS-IL12 group during long-term treatment (14 weeks, >95 days).
Figure 2. 123I-labeled NHS-IL12 accumulates in the lesions of a human A204 tumor xenograft. (A) In vivo SPECT scans performed 2, 26, and 46 h after injection of a therapeutic dose (30 µg) of 123I-labeled NHS-IL12 show specific accumulation of NHS-IL12 in tumor (solid circles) compared to muscle tissue (dotted circles). (B) Uptake of 123I-NHS-IL12 reached its maximum in the tumor lesion 26 h after administration, whereas in muscle no specific signal could be detected over the entire scan time. Counts were decay-corrected to adjust for the radioactive decay of 123I between measurement time points (n = 2). * P ≤ 0.05.

Figure 3. Influence of FcIL-7, NHS-IL12/FcIL-7, and NHS-IL12/IL-2MAB602 on innate immunity. (A) Tumor homogenates of individuals in each cohort were subjected to RT-PCR–based fragment length analysis for the major triggering receptors NKG2C, -D, and -E, DNAM-1, and NK receptors NKp30, −44, and −46. Note the high congruity within a cohort. (B) TCR transcripts indicative of iNKT cells (invariant Vα24 and Vβ11), Vδ1 and −2 chains, and NKp46 at day 52. (C) TCRVα24 mRNA expression in A204 tumors detected as a single peak or in Gaussian distribution. (D) Expression of CD161 in homogenates of tumors and muscles. Quantitative values are given as mean fluorescence intensity. Each dot represents 1 individual tumor. **P ≤ 0.01, ***P ≤ 0.001.
Figure 4. Clonality analysis of αβ T cells treated with FcIL-7, NHS-IL12/FcIL-7, and NHS-IL12/IL-2MAB602. (A) Real-time PCR-based detection of various immune markers in tumor homogenates. Expression of the target gene was normalized to expression of human CD45. (B) Expression of 25 TRBV segments determined by CDR3-size spectratyping. Filled squares indicate expression of up to 12 fragments. Each vertical lane represents 1 mouse; dark squares indicate TRBV segments chosen for CDR3 sequence analysis. (C) CDR3 region protein sequences of selected TRBV segments; bold amino acid codes mark homologous sequences. (D) Expression ratios of T-bet/RORC and Foxp3/CD40L in tumor homogenates (n=4). *P ≤ 0.05, **P ≤ 0.01, ***P ≤ 0.001.
Figure 5. Induction of senescence markers and antiproliferative effect of NHS-IL12/FcIL-7 and NHS-IL12/IL-2MAB602 treatment. (A) Cellular senescence and proliferation within tumor sections were determined by immunofluorescent double-staining for nuclear p-HP1γ or p16INK4a (red) in combination with PCNA or Ki67 (blue), respectively (1:100). Nuclei are shown in green. The inserts show a higher magnification (1:300) to visualize nuclear dots of p-HP1γ or p16INK4a staining. Scale bars represent 100 µm (1:100) and 30 µm (1:300). (B) Mean percentage of p-HP1γ-positive cells (i.e., cells with more than 5 nuclear dots), p16INK4a-positive cells (as determined by higher magnification [1:300]), or Ki67-positive cells after treatment with FcIL-7, NHS-IL12/FcIL-7, or NHS-IL12/IL-2MAB602 (n=3). ** P ≤ 0.01, *** P ≤ 0.001. (C) Cytokine-induced growth arrest in primary human RMS cancer cell preparations. CCA cells (eRMS, passage 7), SRH (eRMS, passage 8), or ZCRH cells (aRMS, passage >9) were seeded at a density of 2 × 10⁴ cells/9.6 cm2. On days 3 and 4 the cells were treated with 100 ng/mL IFN-γ and 10 ng/mL TNF or with medium alone (control). On day 7, the cytokines were removed and the cells were trypsinized, counted, and reseeded at 2 × 10⁴ cells/9.6 cm2. After incubation for another 4 d (ZCRH and SRH) or 10 d (CCA) living cells were counted. Growth curves of the responder cells CCA and SRH and the non-responder cells ZCRH in the absence (Co.) or presence of interferon gamma (IFN-γ) plus tumor necrosis factor (TNF) (n=3).
![Figure 5. Induction of senescence markers and antiproliferative effect of NHS-IL12/FcIL-7 and NHS-IL12/IL-2MAB602 treatment. (A) Cellular senescence and proliferation within tumor sections were determined by immunofluorescent double-staining for nuclear p-HP1γ or p16INK4a (red) in combination with PCNA or Ki67 (blue), respectively (1:100). Nuclei are shown in green. The inserts show a higher magnification (1:300) to visualize nuclear dots of p-HP1γ or p16INK4a staining. Scale bars represent 100 µm (1:100) and 30 µm (1:300). (B) Mean percentage of p-HP1γ-positive cells (i.e., cells with more than 5 nuclear dots), p16INK4a-positive cells (as determined by higher magnification [1:300]), or Ki67-positive cells after treatment with FcIL-7, NHS-IL12/FcIL-7, or NHS-IL12/IL-2MAB602 (n=3). ** P ≤ 0.01, *** P ≤ 0.001. (C) Cytokine-induced growth arrest in primary human RMS cancer cell preparations. CCA cells (eRMS, passage 7), SRH (eRMS, passage 8), or ZCRH cells (aRMS, passage >9) were seeded at a density of 2 × 10⁴ cells/9.6 cm2. On days 3 and 4 the cells were treated with 100 ng/mL IFN-γ and 10 ng/mL TNF or with medium alone (control). On day 7, the cytokines were removed and the cells were trypsinized, counted, and reseeded at 2 × 10⁴ cells/9.6 cm2. After incubation for another 4 d (ZCRH and SRH) or 10 d (CCA) living cells were counted. Growth curves of the responder cells CCA and SRH and the non-responder cells ZCRH in the absence (Co.) or presence of interferon gamma (IFN-γ) plus tumor necrosis factor (TNF) (n=3).](/cms/asset/4b4add43-0a0f-49db-a279-afe9247f7ccd/koni_a_1014760_f0005_c.jpg)
Figure 6. In vivo expression and organization of desmin as a marker of myogenic differentiation in A204 RMS. (A) Histologic slides from tumors (n = 3/cohort) of all cohorts (FcIL-7, NHS-IL12/FcIL-7, or NHS-IL12/IL-2MAB602 treated) were stained for desmin (scale bars: 200 µm) and analyzed by a pathologist (B) in a blinded manner. LT: long-term treatment; ST: short-term treatment.
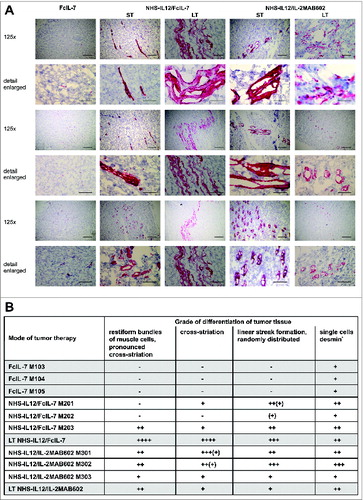
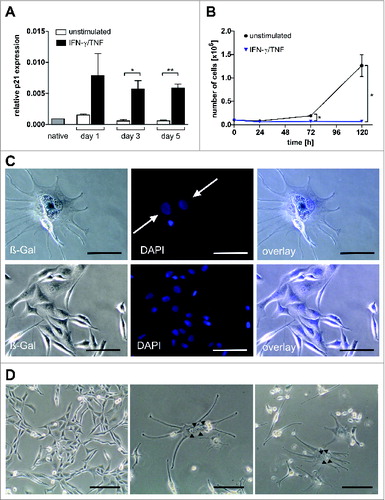
Figure 7. Multinucleate, senescent A204 cells and expression of p21 and myogenic markers in native and cytokine-treated A204 cells. (A) Relative expression of p21 before and after treatment with interferon gamma (IFN-γ) plus tumor necrosis factor (TNF) (++) or medium (–) as a control, measured by quantitative RT-PCR (n = 3). (B) IFN-γ and TNF treatment (blue triangles) terminates cancer cell proliferation but does not kill sarcoma cells (n = 3). For comparison, normal cell cultures (black dot) show unimpeded proliferation (n = 3). (C) Upper lane: Cytokine-treated A204 cancer cells are senescent (black arrow: bluish-gray staining) and multinucleate (white arrows, DAPI staining). Lower lane: A204 sarcoma cells treated with medium as a negative control are negative for SA-β-Gal and mononuclear (DAPI staining). Scale bars: 100 µm. (D) Cytokine-induced elongated, multinucleate, and syncytial morphology in A204 cells (middle and right) compared to A204 cells in standard culture (left), imaged by transmission microscopy. Scale bars: 200 µm.