719
Views
11
CrossRef citations to date
0
Altmetric
Original Research

Phenotypic analysis of T cells infiltrating colon cancers: Correlations with oncogenetic status

, , , , , , , , , & show all
Article: e1016698 | Received 13 Oct 2014, Accepted 03 Feb 2015, Published online: 15 Jul 2015

Figures & data

Figure 1. Differential representation of CD4 and CD8 T cells in peripheral blood, colon lamina propria, and corresponding tumor. (A) Representative FACS analysis of CD4 and CD8 T cell populations in the indicated compartment. (B) Compiled analysis of CD4 and CD8 T cell proportions among total CD3-positive cells in the different compartments (n = 42). The Wilcoxon paired non-parametric t-test was used for statistical analyses (*: P < 0.05). LPL, lamina propria lymphocytes; PBL, peripheral blood lymphocytes; TIL, tumor-infiltrating lymphocytes.
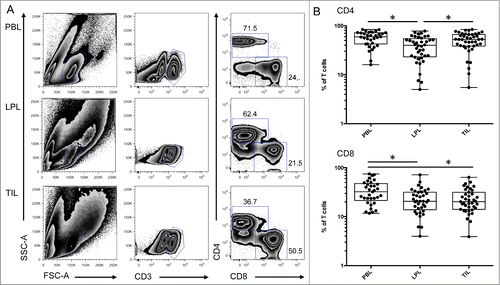
Figure 1. Differential representation of CD4 and CD8 T cells in peripheral blood, colon lamina propria, and corresponding tumor. (A) Representative FACS analysis of CD4 and CD8 T cell populations in the indicated compartment. (B) Compiled analysis of CD4 and CD8 T cell proportions among total CD3-positive cells in the different compartments (n = 42). The Wilcoxon paired non-parametric t-test was used for statistical analyses (*: P < 0.05). LPL, lamina propria lymphocytes; PBL, peripheral blood lymphocytes; TIL, tumor-infiltrating lymphocytes.
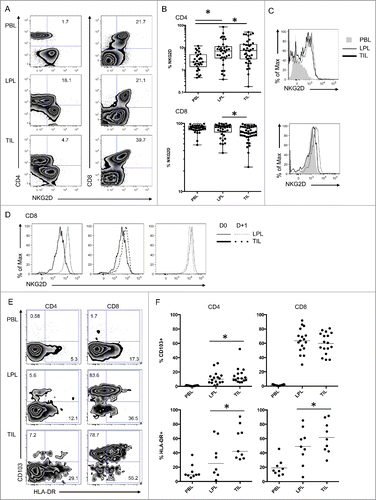
Figure 2 (See previous page). Activation markers and NKG2D expression on mucosal CD4 T cells and tumor infiltrating CD8 T cells. (A) Representative FACS analysis of the indicated compartment for the expression of NKG2D on T cells according to their expression of CD4 and CD8. (B) Compiled analysis of NKG2D expression on CD4 and CD8 T cell populations defined as in 1A (n = 38). The Wilcoxon paired non-parametric t-test was used for statistical analyses (*: P < 0.05). (C) Intensity of NKG2D expression on CD4 and CD8 T cells in the 3 compartments (histograms: gray solid, PBL; thin black line, LPL; heavy black line, TIL). (D) Expression of NKG2D on cells from LPL (thin black line) and TIL (heavy black line) immediately after isolation from the tissues (solid lines) or after overnight culture (dotted lines). (E) Representative FACS analysis of CD4 and CD8 T cells defined as in 1A from PBL, LPL, and TIL for expression of CD103 and HLA-DR. (F) Compiled analysis of CD103 and HLA-DR expression on CD4 and CD8 T cells from the 3 compartments (PBL, LPL, and TIL) (n = 16 and n = 9, respectively). The Wilcoxon paired non-parametric t-test was used for statistical analyses (*: P < 0.05). LPL, lamina propria lymphocytes; PBL, peripheral blood lymphocytes; TIL, tumor-infiltrating lymphocytes.

Figure 2 (See previous page). Activation markers and NKG2D expression on mucosal CD4 T cells and tumor infiltrating CD8 T cells. (A) Representative FACS analysis of the indicated compartment for the expression of NKG2D on T cells according to their expression of CD4 and CD8. (B) Compiled analysis of NKG2D expression on CD4 and CD8 T cell populations defined as in 1A (n = 38). The Wilcoxon paired non-parametric t-test was used for statistical analyses (*: P < 0.05). (C) Intensity of NKG2D expression on CD4 and CD8 T cells in the 3 compartments (histograms: gray solid, PBL; thin black line, LPL; heavy black line, TIL). (D) Expression of NKG2D on cells from LPL (thin black line) and TIL (heavy black line) immediately after isolation from the tissues (solid lines) or after overnight culture (dotted lines). (E) Representative FACS analysis of CD4 and CD8 T cells defined as in 1A from PBL, LPL, and TIL for expression of CD103 and HLA-DR. (F) Compiled analysis of CD103 and HLA-DR expression on CD4 and CD8 T cells from the 3 compartments (PBL, LPL, and TIL) (n = 16 and n = 9, respectively). The Wilcoxon paired non-parametric t-test was used for statistical analyses (*: P < 0.05). LPL, lamina propria lymphocytes; PBL, peripheral blood lymphocytes; TIL, tumor-infiltrating lymphocytes.

Figure 3 (See previous page). Functions of tumor infiltrating lymphocytes compared with T cells from neighboring tissues. (A) Representative FACS analysis of CD4 and CD8 T cells in the indicated compartment (LPL and TIL) for expression of NKG2D and intracellular granzyme A and perforin. (B) Compiled analysis of granzyme A and perforin in mucosal T cells (LPL and TIL) (n = 9). The Wilcoxon paired non-parametric t-test was used for statistical analyses (*: P < 0.05). (C) Representative intracellular FACS analysis of CD4 and CD8 T cells from the indicated compartment (LPL and TIL) for expression of IFNγ and TNFα with or without PMA-ionomycin restimulation. (D) Compiled analysis of IFNγ and TNFα in mucosal T cells with or without PMA-ionomycin restimulation (n = 7). The Wilcoxon paired non-parametric t-test was used for statistical analyses (*: P < 0.05). IFNγ, ιντϵρφϵρµν γαμμα; LPL, lamina propria lymphocytes; PBL, peripheral blood lymphocytes; TIL, tumor-infiltrating lymphocytes; TNFα, tumor necrosis factor.
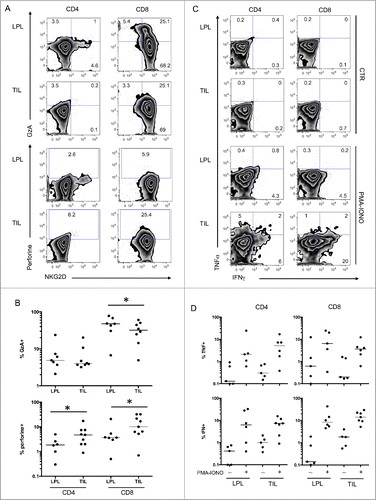
Figure 3 (See previous page). Functions of tumor infiltrating lymphocytes compared with T cells from neighboring tissues. (A) Representative FACS analysis of CD4 and CD8 T cells in the indicated compartment (LPL and TIL) for expression of NKG2D and intracellular granzyme A and perforin. (B) Compiled analysis of granzyme A and perforin in mucosal T cells (LPL and TIL) (n = 9). The Wilcoxon paired non-parametric t-test was used for statistical analyses (*: P < 0.05). (C) Representative intracellular FACS analysis of CD4 and CD8 T cells from the indicated compartment (LPL and TIL) for expression of IFNγ and TNFα with or without PMA-ionomycin restimulation. (D) Compiled analysis of IFNγ and TNFα in mucosal T cells with or without PMA-ionomycin restimulation (n = 7). The Wilcoxon paired non-parametric t-test was used for statistical analyses (*: P < 0.05). IFNγ, ιντϵρφϵρµν γαμμα; LPL, lamina propria lymphocytes; PBL, peripheral blood lymphocytes; TIL, tumor-infiltrating lymphocytes; TNFα, tumor necrosis factor.

Figure 4. Increased expression of CD161 and CD56 on NKG2D-positive CD4 T cells. (A) Representative FACS analysis of CD4 T cells from PBL, LPL, and TIL for co-expression of CD161 and CD56 with NKG2D. (B) Compiled analysis of CD161 and CD56 expression on NKG2D-positive or -negative CD4 T cells from the 3 compartments (n = 18). The Wilcoxon paired non-parametric t-test was used for statistical analyses (*: P < 0.05). LPL, lamina propria lymphocytes; PBL, peripheral blood lymphocytes; TIL, tumor-infiltrating lymphocytes.
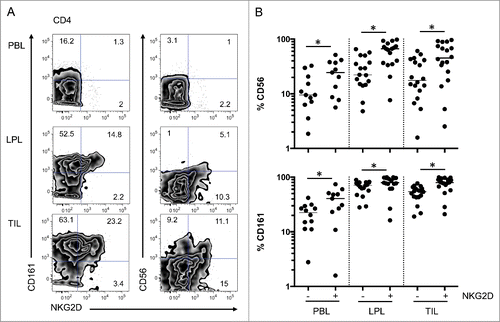
Figure 4. Increased expression of CD161 and CD56 on NKG2D-positive CD4 T cells. (A) Representative FACS analysis of CD4 T cells from PBL, LPL, and TIL for co-expression of CD161 and CD56 with NKG2D. (B) Compiled analysis of CD161 and CD56 expression on NKG2D-positive or -negative CD4 T cells from the 3 compartments (n = 18). The Wilcoxon paired non-parametric t-test was used for statistical analyses (*: P < 0.05). LPL, lamina propria lymphocytes; PBL, peripheral blood lymphocytes; TIL, tumor-infiltrating lymphocytes.
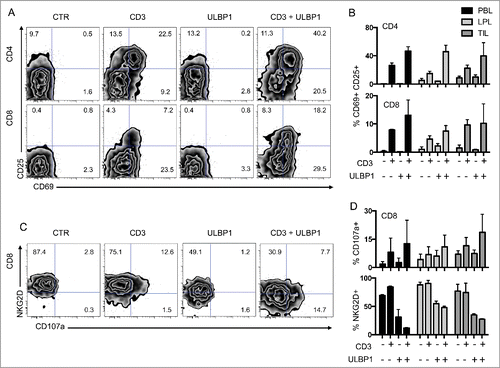
Figure 5. Co-stimulation of CD4 and CD8 T cells through the NKG2D ligand ULBP1. (A) Representative FACS analysis of CD4 and CD8 T cells from PBL co-cultured with P815 cells in control conditions (CTR), P815 cells incubated with anti-CD3 antibodies (CD3), P815 cells expressing ULBP1 (ULBP1), or P815 cells expressing ULBP1 in the presence of anti-CD3 antibody (CD3 + ULBP1). Activation was assessed by the expression of CD69 and CD25 at the cell surface of T cells. (B) Compiled analysis of CD4 and CD8 T-cell activation from the 3 compartments (PBL, LPL, and TIL) (n = 3). Mean and SEM are represented. (C) Representative FACS analysis of CD8 T cells from PBL co-cultured with P815 cells as in (A). NKG2D and CD107a expression was measured to assess degranulation. (D) Compiled analysis of CD8 T-cell activation from the 3 compartments (PBL, LPL, and TIL) (n = 3). Mean and SEM are represented. LPL, lamina propria lymphocytes; PBL, peripheral blood lymphocytes; TIL, tumor-infiltrating lymphocytes.

Figure 5. Co-stimulation of CD4 and CD8 T cells through the NKG2D ligand ULBP1. (A) Representative FACS analysis of CD4 and CD8 T cells from PBL co-cultured with P815 cells in control conditions (CTR), P815 cells incubated with anti-CD3 antibodies (CD3), P815 cells expressing ULBP1 (ULBP1), or P815 cells expressing ULBP1 in the presence of anti-CD3 antibody (CD3 + ULBP1). Activation was assessed by the expression of CD69 and CD25 at the cell surface of T cells. (B) Compiled analysis of CD4 and CD8 T-cell activation from the 3 compartments (PBL, LPL, and TIL) (n = 3). Mean and SEM are represented. (C) Representative FACS analysis of CD8 T cells from PBL co-cultured with P815 cells as in (A). NKG2D and CD107a expression was measured to assess degranulation. (D) Compiled analysis of CD8 T-cell activation from the 3 compartments (PBL, LPL, and TIL) (n = 3). Mean and SEM are represented. LPL, lamina propria lymphocytes; PBL, peripheral blood lymphocytes; TIL, tumor-infiltrating lymphocytes.

Figure 6. T-cell populations vary in function of the type of oncogenic status of the tumor. (A) Comparison of the percentage of CD4 and CD8 T cells in PBL, LPL, and TIL from patients with microsatellite instability (MSI) or stability (MSS). (B) Comparison of the percentage of CD4 and CD8 T cells in PBL, LPL, and TIL from MSS patients with or without identified KRAS or NRAS mutations. LPL, lamina propria lymphocytes; MSI, microsatellite instability; MSS, microsatellite stable; PBL, peripheral blood lymphocytes; TIL, tumor-infiltrating lymphocytes.
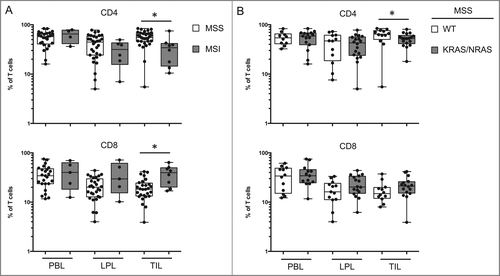
Figure 6. T-cell populations vary in function of the type of oncogenic status of the tumor. (A) Comparison of the percentage of CD4 and CD8 T cells in PBL, LPL, and TIL from patients with microsatellite instability (MSI) or stability (MSS). (B) Comparison of the percentage of CD4 and CD8 T cells in PBL, LPL, and TIL from MSS patients with or without identified KRAS or NRAS mutations. LPL, lamina propria lymphocytes; MSI, microsatellite instability; MSS, microsatellite stable; PBL, peripheral blood lymphocytes; TIL, tumor-infiltrating lymphocytes.

Table 1. Characteristics of the 42 patients with colorectal cancer

Supplemental material

KONI_A_1016698_SUP_FIG_2.pdf

Download PDF (48 KB)

KONI_A_1016698_SUP_FIG_1.pdf

Download PDF (126.7 KB)

Reprints and Corporate Permissions

Please note: Selecting permissions does not provide access to the full text of the article, please see our help page How do I view content?

To request a reprint or corporate permissions for this article, please click on the relevant link below:

Academic Permissions

Please note: Selecting permissions does not provide access to the full text of the article, please see our help page How do I view content?

Obtain permissions instantly via Rightslink by clicking on the button below:

If you are unable to obtain permissions via Rightslink, please complete and submit this Permissions form. For more information, please visit our Permissions help page.