1,433
Views
19
CrossRef citations to date
0
Altmetric
Original Research

The nitric oxide radical scavenger carboxy-PTIO reduces the immunosuppressive activity of myeloid-derived suppressor cells and potentiates the antitumor activity of adoptive cytotoxic T lymphocyte immunotherapy

, , , , , , & show all
Article: e1019195 | Received 13 Jan 2015, Accepted 09 Feb 2015, Published online: 30 Jun 2015

Figures & data

Figure 1. Adoptively-transferred CTLs are impaired in the tumor. (A) C57BL/6 mice were injected with B16 melanoma cells (1 × 10⁶), and 9 d later (designated as day 0), tumor-bearing mice (n = 5) received in vitro-activated pmel-1 splenocytes (1 × 10⁷) as CTLs. Tumor volumes were measured every other day. (B) Mice (n = 3) were killed on days 3, 5, 7, and 17 after CTL transfer and infiltration of CTLs into the tumor was analyzed by flow cytometry. The frequency of CTLs in the tumor was determined by quantifying eFluor450CD45+CD8+CD90.1+ cells. (C) The absolute number of CTLs was calculated as described in the Materials and Methods section and adjusted by the tumor weight (cells/g). (D) IFNγ production by CTLs with or without stimulation with 1 μg/mL hgp100 peptide for 4 h was analyzed on days 3, 5, 7, and 17 after CTL transfer by intracellular staining (n = 3 per group). The experiments were performed independently at least three times with similar results.
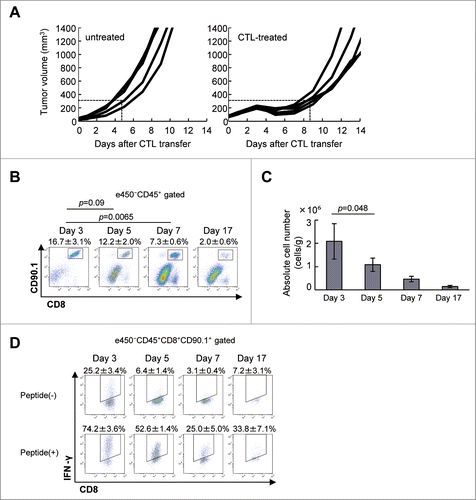
Figure 1. Adoptively-transferred CTLs are impaired in the tumor. (A) C57BL/6 mice were injected with B16 melanoma cells (1 × 10⁶), and 9 d later (designated as day 0), tumor-bearing mice (n = 5) received in vitro-activated pmel-1 splenocytes (1 × 10⁷) as CTLs. Tumor volumes were measured every other day. (B) Mice (n = 3) were killed on days 3, 5, 7, and 17 after CTL transfer and infiltration of CTLs into the tumor was analyzed by flow cytometry. The frequency of CTLs in the tumor was determined by quantifying eFluor450−CD45+CD8+CD90.1+ cells. (C) The absolute number of CTLs was calculated as described in the Materials and Methods section and adjusted by the tumor weight (cells/g). (D) IFNγ production by CTLs with or without stimulation with 1 μg/mL hgp100 peptide for 4 h was analyzed on days 3, 5, 7, and 17 after CTL transfer by intracellular staining (n = 3 per group). The experiments were performed independently at least three times with similar results.

Figure 2 (See previous page). CTL-induced M-MDSCs produce NO. (A) C57BL/6 mice were injected with B16 melanoma cells and 9 days later, tumor-bearing mice (n = 3) were treated as described in . Tumor-infiltrating cells were analyzed on days 0, 5, and 10 after CTL transfer. The absolute number of eFluor450CD45+ cells at the indicated time points is shown. (B) The eFluor450CD45+ cells were stained with anti-CD11b and -Gr1 mAbs to detect MDSCs. (C) The absolute number of CD11b+Gr1+ cells at the indicated time points is shown, numbers of cells in each population were calculated as described in the Materials and Methods section and adjusted by the tumor weight (cells/g). (D) Monocytic MDSC were gated as Gr1intLy6C+ cells in the CD11b+Gr1+ population. (E) The absolute numbers of Gr1intLy6C+ monocytic MDSC are shown. (F) CD11b+Gr1+ cells were stained with Diff-quick as described in Materials and Methods; their morphology was assessed using an OLYMPUS BX41 microscope (magnification ×400 left, ×1000 right). (G) Sorted CD11b+Gr1+ cells in F were incubated for 30 min at 37°C with 5 μM DAF-FM (Diaminofluorescein-FM) (SEKISUI MEDICAL) and then stained with biotin-conjugated anti-Gr1, followed by staining with PE-conjugated anti-CD11b, Streptavidin-APC and analyzed by FLUOVIEW FV10 i (OLYMPUS, Tokyo, Japan). The experiments were performed independently at least three times with similar results.
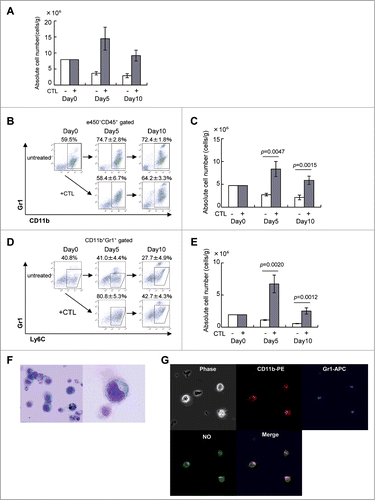
Figure 2 (See previous page). CTL-induced M-MDSCs produce NO. (A) C57BL/6 mice were injected with B16 melanoma cells and 9 days later, tumor-bearing mice (n = 3) were treated as described in Fig. 1. Tumor-infiltrating cells were analyzed on days 0, 5, and 10 after CTL transfer. The absolute number of eFluor450−CD45+ cells at the indicated time points is shown. (B) The eFluor450−CD45+ cells were stained with anti-CD11b and -Gr1 mAbs to detect MDSCs. (C) The absolute number of CD11b+Gr1+ cells at the indicated time points is shown, numbers of cells in each population were calculated as described in the Materials and Methods section and adjusted by the tumor weight (cells/g). (D) Monocytic MDSC were gated as Gr1intLy6C+ cells in the CD11b+Gr1+ population. (E) The absolute numbers of Gr1intLy6C+ monocytic MDSC are shown. (F) CD11b+Gr1+ cells were stained with Diff-quick as described in Materials and Methods; their morphology was assessed using an OLYMPUS BX41 microscope (magnification ×400 left, ×1000 right). (G) Sorted CD11b+Gr1+ cells in F were incubated for 30 min at 37°C with 5 μM DAF-FM (Diaminofluorescein-FM) (SEKISUI MEDICAL) and then stained with biotin-conjugated anti-Gr1, followed by staining with PE-conjugated anti-CD11b, Streptavidin-APC and analyzed by FLUOVIEW FV10 i (OLYMPUS, Tokyo, Japan). The experiments were performed independently at least three times with similar results.

Figure 3. MDSCs inhibit the proliferation of antigen-specific CTLs via NO production. C57BL/6 mice were treated as described in . Tumor-infiltrating cells were prepared from pooled B16 tumors (n = 12) 3 d after CTL transfer and CD11b+Gr1+ cells were positively selected using anti-CD11b magnetic beads. CFSE-labeled pmel-1 CTL were stimulated with hgp100 peptide in the presence or absence of CD11b+Gr1+ cells at the indicated ratio. The proliferation of pmel-1 cells was evaluated by flow cytometry. This was studied in the presence of carboxy-PTIO or L-NMMA. Numbers on the images show the percentage of gated cells (mean ±SD). All experiments shown were performed independently at least three times with similar results.
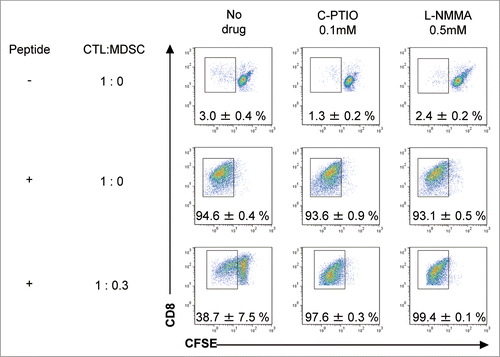
Figure 3. MDSCs inhibit the proliferation of antigen-specific CTLs via NO production. C57BL/6 mice were treated as described in Fig. 1. Tumor-infiltrating cells were prepared from pooled B16 tumors (n = 12) 3 d after CTL transfer and CD11b+Gr1+ cells were positively selected using anti-CD11b magnetic beads. CFSE-labeled pmel-1 CTL were stimulated with hgp100 peptide in the presence or absence of CD11b+Gr1+ cells at the indicated ratio. The proliferation of pmel-1 cells was evaluated by flow cytometry. This was studied in the presence of carboxy-PTIO or L-NMMA. Numbers on the images show the percentage of gated cells (mean ±SD). All experiments shown were performed independently at least three times with similar results.

Figure 4. Elimination of NO by C-PTIO potentiates the antitumor activity of CTLs. (A) B16 melanoma cells (1 × 10⁶) were implanted intradermally in C57BL/6 mice. Mice were divided into four groups: untreated, Carboxy-PTIO-treated, CTL-treated or CTL and C-PTIO-treated (5–7 mice per group). Nine days later (designated as day 0), tumor-bearing mice received 1 × 10⁷ CTLs. From day 1 to day 10, C-PTIO (2 mg/200 μl PBS) was injected twice daily i.p. Tumor growth was measured every other day. (B) Mice (n = 3 per group) were killed on day 3 and NO expression in CD11b+Gr1+ MDSCs was compared between CTL-treated mice and CTL+C-PTIO-treated mice.
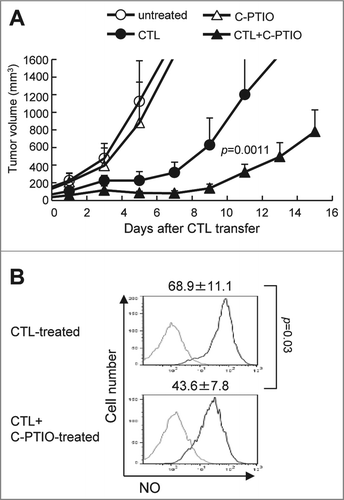
Figure 4. Elimination of NO by C-PTIO potentiates the antitumor activity of CTLs. (A) B16 melanoma cells (1 × 10⁶) were implanted intradermally in C57BL/6 mice. Mice were divided into four groups: untreated, Carboxy-PTIO-treated, CTL-treated or CTL and C-PTIO-treated (5–7 mice per group). Nine days later (designated as day 0), tumor-bearing mice received 1 × 10⁷ CTLs. From day 1 to day 10, C-PTIO (2 mg/200 μl PBS) was injected twice daily i.p. Tumor growth was measured every other day. (B) Mice (n = 3 per group) were killed on day 3 and NO expression in CD11b+Gr1+ MDSCs was compared between CTL-treated mice and CTL+C-PTIO-treated mice.

Figure 5. NO Scavenger C-PTIO restores CTL function. (A) Mice were treated as described in the legend to . TILs were harvested from tumors on days 3 or 7. CTLs in the tumor were analyzed by flow cytometry (left). The absolute number of CTLs was calculated (right). (B) BrdU incorporation by CTLs in the tumor and draining lymph node (DLN) on days 3 and 7 was analyzed by flow cytometry as described in the Materials and Methods section. (C) IFNγ production by CTLs on days 3 and 7 with or without 1 μg/mL hgp100 peptide. (D) The absolute number of IFNγ+ CTLs is shown. (E) CD107a expression on CTLs on days 3 and 7 with or without 1 μg/mL hgp100 peptide. (F) The absolute number of CD107a+ CTLs is shown.
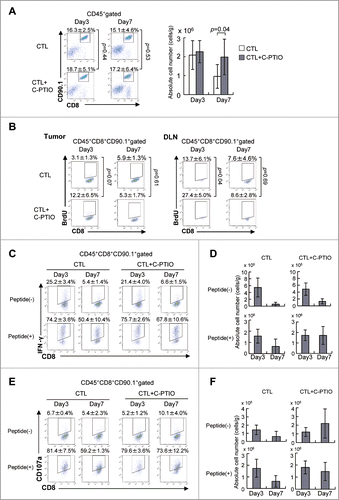
Figure 5. NO Scavenger C-PTIO restores CTL function. (A) Mice were treated as described in the legend to Fig. 4. TILs were harvested from tumors on days 3 or 7. CTLs in the tumor were analyzed by flow cytometry (left). The absolute number of CTLs was calculated (right). (B) BrdU incorporation by CTLs in the tumor and draining lymph node (DLN) on days 3 and 7 was analyzed by flow cytometry as described in the Materials and Methods section. (C) IFNγ production by CTLs on days 3 and 7 with or without 1 μg/mL hgp100 peptide. (D) The absolute number of IFNγ+ CTLs is shown. (E) CD107a expression on CTLs on days 3 and 7 with or without 1 μg/mL hgp100 peptide. (F) The absolute number of CD107a+ CTLs is shown.

Figure 6. Expression of genes related to effector (A) and immunoregulatory (B) functions. Mice were treated as described in the legend to . Tumor tissues from CTL-treated mice and CTL+C-PTIO-treated mice were harvested on days 3 and 7. Total RNA was extracted from each tumor tissue and the expression of the indicated genes determined by qRT-PCR.
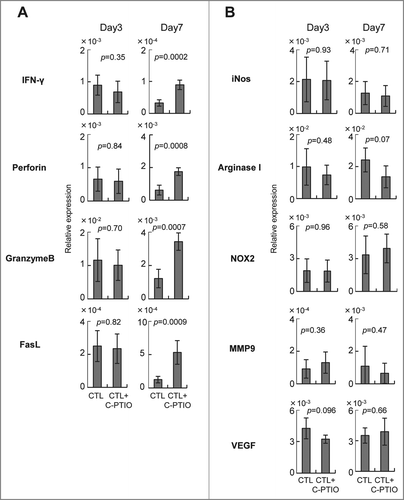
Figure 6. Expression of genes related to effector (A) and immunoregulatory (B) functions. Mice were treated as described in the legend to Figure 4. Tumor tissues from CTL-treated mice and CTL+C-PTIO-treated mice were harvested on days 3 and 7. Total RNA was extracted from each tumor tissue and the expression of the indicated genes determined by qRT-PCR.

Reprints and Corporate Permissions

Please note: Selecting permissions does not provide access to the full text of the article, please see our help page How do I view content?

To request a reprint or corporate permissions for this article, please click on the relevant link below:

Academic Permissions

Please note: Selecting permissions does not provide access to the full text of the article, please see our help page How do I view content?

Obtain permissions instantly via Rightslink by clicking on the button below:

If you are unable to obtain permissions via Rightslink, please complete and submit this Permissions form. For more information, please visit our Permissions help page.