1,730
Views
9
CrossRef citations to date
0
Altmetric
Original Research

Depletion of B220+NK1.1+ cells enhances the rejection of established melanoma by tumor-specific CD4+ T cells

, , , &
Article: e1019196 | Received 14 Jan 2015, Accepted 09 Feb 2015, Published online: 30 Jun 2015

Figures & data

Figure 1. NK1.1+ cell depletion enhances the rejection of established melanoma by adoptively transferred TRP-1-secific CD4+ T cells. RAG−/− mice were inoculated subcutaneously with 3×10⁵ B16.F10 on day 0 and left untreated (A), received ACT of 5×10⁴ TRP-1-specific CD4+ T cells on day 7 (B), or received ACT on day 7 plus 200 μg of anti-NK1.1 intraperitoneally on days 0, 7, and 14 (C). A, B, and C show tumor area as a function of time post tumor inoculation for each mouse in each experimental group. **, p < 0.0001. (D) Anti-NK1.1 antibody alone has no effect on the rejection of established melanoma. RAG−/− mice were inoculated subcutaneously with 3×10⁵ B16.F10 on day 0 and left untreated or received 200 μg of anti-NK1.1 intraperitoneally on days 0, 7, and 14. (D) Tumor area as a function of time for each replicate of each experimental group is plotted. (E) Anti-NK1.1 antibody depletes NK cells. Splenocytes from each indicated experimental group were harvested at day 21 post tumor inoculation and analyzed for the presence of NK cells and pre-mNK cells.
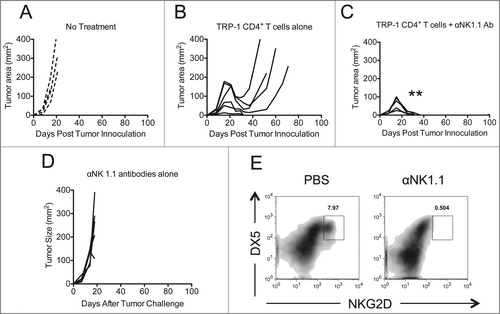
Figure 1. NK1.1+ cell depletion enhances the rejection of established melanoma by adoptively transferred TRP-1-secific CD4+ T cells. RAG−/− mice were inoculated subcutaneously with 3×10⁵ B16.F10 on day 0 and left untreated (A), received ACT of 5×10⁴ TRP-1-specific CD4+ T cells on day 7 (B), or received ACT on day 7 plus 200 μg of anti-NK1.1 intraperitoneally on days 0, 7, and 14 (C). A, B, and C show tumor area as a function of time post tumor inoculation for each mouse in each experimental group. **, p < 0.0001. (D) Anti-NK1.1 antibody alone has no effect on the rejection of established melanoma. RAG−/− mice were inoculated subcutaneously with 3×10⁵ B16.F10 on day 0 and left untreated or received 200 μg of anti-NK1.1 intraperitoneally on days 0, 7, and 14. (D) Tumor area as a function of time for each replicate of each experimental group is plotted. (E) Anti-NK1.1 antibody depletes NK cells. Splenocytes from each indicated experimental group were harvested at day 21 post tumor inoculation and analyzed for the presence of NK cells and pre-mNK cells.

Figure 2. NK1.1+ cell depletion enhances survival and autoimmune vitiligo, increases the effector function of TRP-1 CD4+ T cells, and prevents recurrence of melanoma. (A) Percent survival for each of the aforementioned experimental groups was plotted as a function of time post tumor inoculation. *, p < 0.05. (B) Percent of body area affected by vitiligo was determined for each experimental group 35 d post tumor inoculation, *, p < 0.05. (C) 17–21 d post tumor inoculation, spleens were harvested from animals in each experimental group, made into a single cell suspension, and stained with anti-CD4. The absolute number of CD4+ T cells isolated from each spleen was determined, p < 0.05. (D) Splenocytes were stained for the indicated markers. (E) Mice receiving anti-NK1.1 in addition to ACT experienced patchy, irregular, vitiligo earlier than animals receiving ACT alone. (F) Tumor areas from each experimental group plotted as a function of time show that animals receiving anti-NK1.1 in addition to ACT experience tumor relapse at a significantly lower rate than animals receiving ACT alone, p < 0.05.
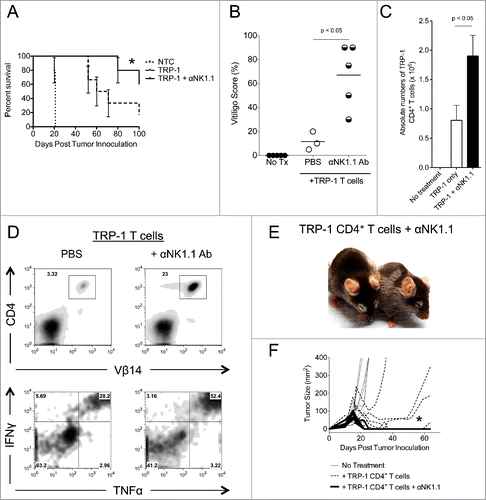
Figure 2. NK1.1+ cell depletion enhances survival and autoimmune vitiligo, increases the effector function of TRP-1 CD4+ T cells, and prevents recurrence of melanoma. (A) Percent survival for each of the aforementioned experimental groups was plotted as a function of time post tumor inoculation. *, p < 0.05. (B) Percent of body area affected by vitiligo was determined for each experimental group 35 d post tumor inoculation, *, p < 0.05. (C) 17–21 d post tumor inoculation, spleens were harvested from animals in each experimental group, made into a single cell suspension, and stained with anti-CD4. The absolute number of CD4+ T cells isolated from each spleen was determined, p < 0.05. (D) Splenocytes were stained for the indicated markers. (E) Mice receiving anti-NK1.1 in addition to ACT experienced patchy, irregular, vitiligo earlier than animals receiving ACT alone. (F) Tumor areas from each experimental group plotted as a function of time show that animals receiving anti-NK1.1 in addition to ACT experience tumor relapse at a significantly lower rate than animals receiving ACT alone, p < 0.05.

Table 1. Recurrence rates compared between mouse strains and different antibody therapies. Recurrence rates represent the percentage of mice that had recurred during the first 100 d after therapy

Figure 3. NK1.1+ cell depletion in addition to ACT increases the serum concentration of pro-inflammatory cytokines. On day 14 post tumor inoculation, serum was harvested from each experimental group, and analyzed by Milliplex for the concentration of (A) IFNγ and TNFα, (B) CXCL9 and CXCL10 and (C), IL-2, IL-7, and IL-15.
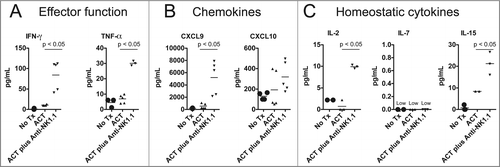
Figure 3. NK1.1+ cell depletion in addition to ACT increases the serum concentration of pro-inflammatory cytokines. On day 14 post tumor inoculation, serum was harvested from each experimental group, and analyzed by Milliplex for the concentration of (A) IFNγ and TNFα, (B) CXCL9 and CXCL10 and (C), IL-2, IL-7, and IL-15.

Figure 4. Asialo-GM1+ cell depletion does not enhance the rejection of established melanoma to the same extent as NK1.1+ cell depletion. RAG−/− mice were inoculated subcutaneously with 3×10⁵ B16.F10 on day 0 and left untreated (A), received ACT of 5×10⁴ TRP-1-specific CD4+ T cells on day 7 (B), or received ACT on day 7 plus 20 μL of anti-Asialo-GM1 intraperitoneally on days 2, 0, 7, and 14 (C). A, B, and C show tumor area as a function of time post tumor inoculation for each mouse in each experimental group. *, p < 0.05. (D) Percent survival for each of the aforementioned experimental groups was plotted as a function of time post tumor inoculation. There is no significant difference between the survival of mice treated with TRP-1 cells vs. mice treated with TRP-1 cells plus anti-Asialo-GM1, p > 0.05. (E) On day 21 post tumor inoculation, splenocytes were isolated from the indicated experimental groups and analyzed for the presence of NK cells.
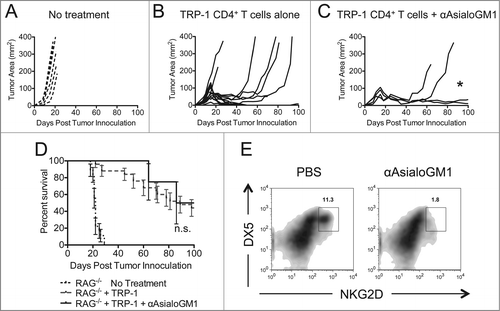
Figure 4. Asialo-GM1+ cell depletion does not enhance the rejection of established melanoma to the same extent as NK1.1+ cell depletion. RAG−/− mice were inoculated subcutaneously with 3×10⁵ B16.F10 on day 0 and left untreated (A), received ACT of 5×10⁴ TRP-1-specific CD4+ T cells on day 7 (B), or received ACT on day 7 plus 20 μL of anti-Asialo-GM1 intraperitoneally on days 2, 0, 7, and 14 (C). A, B, and C show tumor area as a function of time post tumor inoculation for each mouse in each experimental group. *, p < 0.05. (D) Percent survival for each of the aforementioned experimental groups was plotted as a function of time post tumor inoculation. There is no significant difference between the survival of mice treated with TRP-1 cells vs. mice treated with TRP-1 cells plus anti-Asialo-GM1, p > 0.05. (E) On day 21 post tumor inoculation, splenocytes were isolated from the indicated experimental groups and analyzed for the presence of NK cells.

Figure 5. Tumor therapy is enhanced in IL-15−/−RAG−/− mice. (A) Splenocytes from each indicated experimental group were harvested at day 21 post tumor inoculation and analyzed for the presence of NK cells and pre-mNK cells. (B) IL-15−/−RAG−/− mice were inoculated subcutaneously with 3×10⁵ B16.F10 on day 0 and left untreated or received ACT of 5×10⁴ TRP-1-specific CD4+ T cells. Tumor area as a function of time for each replicate of each experimental group is plotted. Compared to RAG−/− historical controls, **, p < 0.0001. (C) Percent survival for each of the aforementioned experimental groups was plotted as a function of time post tumor inoculation. Survival differences between RAG−/− and IL-15−/−RAG−/− treated with TRP-1 cells are significantly different, *, P < 0.05. (D) Absolute cell numbers of TRP-1 CD4+ T cells and NK cells from individual groups (RAG−/− vs. IL-15−/−RAG−/−) as shown 7 d after adoptive T cell transfer.
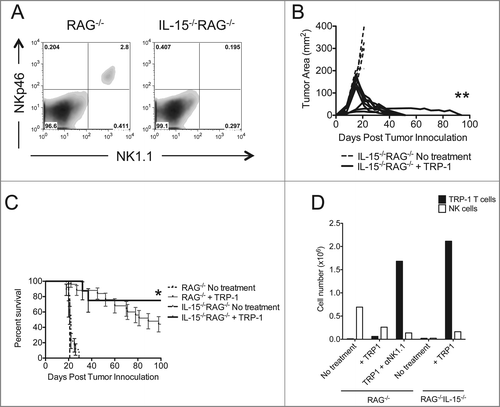
Figure 5. Tumor therapy is enhanced in IL-15−/−RAG−/− mice. (A) Splenocytes from each indicated experimental group were harvested at day 21 post tumor inoculation and analyzed for the presence of NK cells and pre-mNK cells. (B) IL-15−/−RAG−/− mice were inoculated subcutaneously with 3×10⁵ B16.F10 on day 0 and left untreated or received ACT of 5×10⁴ TRP-1-specific CD4+ T cells. Tumor area as a function of time for each replicate of each experimental group is plotted. Compared to RAG−/− historical controls, **, p < 0.0001. (C) Percent survival for each of the aforementioned experimental groups was plotted as a function of time post tumor inoculation. Survival differences between RAG−/− and IL-15−/−RAG−/− treated with TRP-1 cells are significantly different, *, P < 0.05. (D) Absolute cell numbers of TRP-1 CD4+ T cells and NK cells from individual groups (RAG−/− vs. IL-15−/−RAG−/−) as shown 7 d after adoptive T cell transfer.

Figure 6. Depletion of pre-mNK cells by anti-B220 enhances the rejection of established melanoma. RAG−/− mice were inoculated subcutaneously with 3×10⁵ B16.F10 on day 0 and left untreated, received ACT of 5×10⁴ TRP-1-specific CD4+ T cells on day 7, or received ACT on day 7 plus 200 μg of anti-B220 intraperitoneally on days 0, 7, and 14. (A) Splenocytes from each indicated experimental group were harvested at day 21 post tumor inoculation and analyzed for the presence of NK cells and pre-mNK cells. (B) Tumor area as a function of time for each replicate of each experimental group is plotted. **, p < 0.0001. (C) Percent survival for each of the aforementioned experimental groups was plotted as a function of time post tumor inoculation. Percent survival for each group is significantly different, **, p < 0.0001.
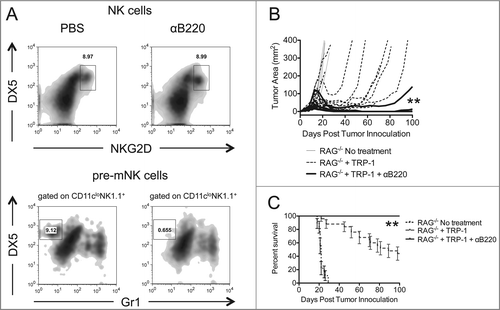
Figure 6. Depletion of pre-mNK cells by anti-B220 enhances the rejection of established melanoma. RAG−/− mice were inoculated subcutaneously with 3×10⁵ B16.F10 on day 0 and left untreated, received ACT of 5×10⁴ TRP-1-specific CD4+ T cells on day 7, or received ACT on day 7 plus 200 μg of anti-B220 intraperitoneally on days 0, 7, and 14. (A) Splenocytes from each indicated experimental group were harvested at day 21 post tumor inoculation and analyzed for the presence of NK cells and pre-mNK cells. (B) Tumor area as a function of time for each replicate of each experimental group is plotted. **, p < 0.0001. (C) Percent survival for each of the aforementioned experimental groups was plotted as a function of time post tumor inoculation. Percent survival for each group is significantly different, **, p < 0.0001.
Supplemental material

2015ONCOIMM0036R-f07-z-bw.pdf

Download PDF (38.1 KB)