1,116
Views
23
CrossRef citations to date
0
Altmetric
Original Research

Anti-proliferative and pro-apoptotic activity of GD2 ganglioside-specific monoclonal antibody 3F8 in human melanoma cells

, , , , , & show all
Article: e1023975 | Received 03 Feb 2015, Accepted 20 Feb 2015, Published online: 25 Jul 2015

Figures & data

Figure 1. Inhibition by GD2-specific mAb 3F8 of GD2(+) human melanoma cell line growth. (A and B) HTB63 cells were seeded in flat bottom 96-well plates (3 × 10³/well) and incubated with the indicated concentrations of mAb 3F8. mAb HO-1 was used as an isotype matched control (Ctrl). Following an up to 72 h incubation at 37°C in a 5% CO2 atmosphere, cell growth inhibition was determined by Cell Counting Kit-8 (CCK-8) assay (A) (left panel). Cell density and morphology of HTB63 cells were monitored under a bright field light microscope. Representative results of HTB63 cells treated with the mAb 3F8 or the isotype matched control mAb HO-1 (Ctrl) following an incubation at indicated times at 37°C in a 5% CO2 atmosphere are shown. Magnification is indicated (A) (right panel). (C) Thirteen human melanoma cell lines were incubated with mAb 3F8 (20 μg/ml). Following an up to 72 h incubation at 37°C in a 5% CO2 atmosphere, cell growth inhibition was determined by CCK-8 assay. Expression levels of GD2, defined as geometric mean (G.M.) fluorescence intensity of mAb 3F8 on the human melanoma cell lines tested (data not shown), was correlated with % of growth inhibition. R2 value as determined by the two order polynomial regression is indicated. The results presented are representative of those obtained in at least two independent experiments. (D) HTB63 cells were incubated with a mixture of mAb 3F8 (30 μg/ml) and anti-id mAb A1G4 (30 μg/ml). A mixture of mAb 3F8 and mAb MK2–23 (30 μg/ml) was used as a specificity control (Ctrl). Following an up to 48 h incubation at 37°C in a 5% CO2 atmosphere, cell growth inhibition was determined by CCK-8 assay. Data are expressed as mean ± standard deviations (SD) of the results obtained in three independent experiments.
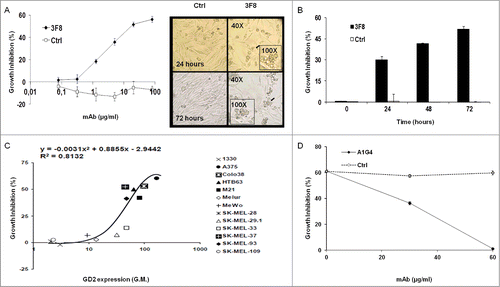
Figure 1. Inhibition by GD2-specific mAb 3F8 of GD2(+) human melanoma cell line growth. (A and B) HTB63 cells were seeded in flat bottom 96-well plates (3 × 10³/well) and incubated with the indicated concentrations of mAb 3F8. mAb HO-1 was used as an isotype matched control (Ctrl). Following an up to 72 h incubation at 37°C in a 5% CO2 atmosphere, cell growth inhibition was determined by Cell Counting Kit-8 (CCK-8) assay (A) (left panel). Cell density and morphology of HTB63 cells were monitored under a bright field light microscope. Representative results of HTB63 cells treated with the mAb 3F8 or the isotype matched control mAb HO-1 (Ctrl) following an incubation at indicated times at 37°C in a 5% CO2 atmosphere are shown. Magnification is indicated (A) (right panel). (C) Thirteen human melanoma cell lines were incubated with mAb 3F8 (20 μg/ml). Following an up to 72 h incubation at 37°C in a 5% CO2 atmosphere, cell growth inhibition was determined by CCK-8 assay. Expression levels of GD2, defined as geometric mean (G.M.) fluorescence intensity of mAb 3F8 on the human melanoma cell lines tested (data not shown), was correlated with % of growth inhibition. R2 value as determined by the two order polynomial regression is indicated. The results presented are representative of those obtained in at least two independent experiments. (D) HTB63 cells were incubated with a mixture of mAb 3F8 (30 μg/ml) and anti-id mAb A1G4 (30 μg/ml). A mixture of mAb 3F8 and mAb MK2–23 (30 μg/ml) was used as a specificity control (Ctrl). Following an up to 48 h incubation at 37°C in a 5% CO2 atmosphere, cell growth inhibition was determined by CCK-8 assay. Data are expressed as mean ± standard deviations (SD) of the results obtained in three independent experiments.

Figure 2. Apoptosis induction by GD2-specific mAb 3F8 in human melanoma cell lines. (A) HTB63 cells were seeded in flat bottom six-well plates (2 × 10⁵/well) and incubated with mAb 3F8 (50 μg/ml). mAb HO-1 was used as an isotype matched control (Ctrl). Following a 48 h incubation at 37°C in a 5% CO2 atmosphere, apoptosis induction was determined by Annexin V/7-AAD staining. Percentage of cells in different phases of apoptosis is indicated. (B) Colo38, HTB63, M21 and Melur cells were incubated with mAb 3F8 (50 μg/ml). mAb HO-1 was used as an isotype matched control (Ctrl). Following a 24 h incubation at 37°C in a 5% CO2 atmosphere, apoptosis induction was determined by PI staining. A representative result obtained in HTB63 cells is shown (upper panel). Percentage of apoptotic cells detected as sub-diploid cells (SubG1 population) was correlated with expression levels of GD2 in the cell lines tested (lower panel). R2 value as determined by the two order polynomial regression is indicated. The results presented are representative of those obtained in three independent experiments. (C) HTB63 cells were incubated with mAb 3F8 (50 μg/ml). mAb HO-1 was used as an isotype matched control (Ctrl). Untreated cells (Medium) and Jurkat cells treated with etoposide were used as a background and as a positive control for caspase 9 induction (Ctrl +), respectively. Following an incubation at 37°C in a 5% CO2 atmosphere for the indicated times, cells were harvested and lysed. Cell lysates were analyzed by protein gel blot with the indicated mAbs. Calnexin was used as a loading control. The data shown are representative of the results obtained in three independent experiments. (D) HTB63 and M21 cells were incubated with mAb 3F8 (3F8) (50 μg/ml). Following an up to 24 h incubation at 37°C in a 5% CO2 atmosphere enzymatic activity of activated caspase 3/7 in the cells was measured by Apo-ONE® Homogeneous Caspase 3/7 Assay. Data are expressed as mean ± SD of the results obtained in three independent experiments. (E) HTB63 cells were pre-incubated with 40 μM of the Pan-caspase inhibitor Boc-D-FMK, caspase 3 inhibitor Z-DQMD-FMK, caspase 8 inhibitor Z-IETD-FMK or caspase 9 inhibitor Z-LEHD-FMK. Following a 60 min incubation at 37°C in a 5% CO2 atmosphere cells were then incubated with mAb 3F8 (50 μg/ml). Following a 24 h incubation at 37°C in a 5% CO2 atmosphere apoptosis induction was determined by PI staining. Percentages of apoptotic cells detected as sub-diploid cells (SubG1 population) are shown. Data are expressed as mean ± SD of the results obtained in three independent experiments.
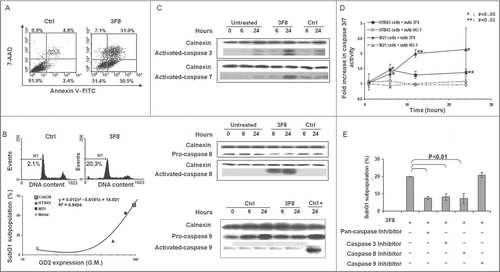
Figure 2. Apoptosis induction by GD2-specific mAb 3F8 in human melanoma cell lines. (A) HTB63 cells were seeded in flat bottom six-well plates (2 × 10⁵/well) and incubated with mAb 3F8 (50 μg/ml). mAb HO-1 was used as an isotype matched control (Ctrl). Following a 48 h incubation at 37°C in a 5% CO2 atmosphere, apoptosis induction was determined by Annexin V/7-AAD staining. Percentage of cells in different phases of apoptosis is indicated. (B) Colo38, HTB63, M21 and Melur cells were incubated with mAb 3F8 (50 μg/ml). mAb HO-1 was used as an isotype matched control (Ctrl). Following a 24 h incubation at 37°C in a 5% CO2 atmosphere, apoptosis induction was determined by PI staining. A representative result obtained in HTB63 cells is shown (upper panel). Percentage of apoptotic cells detected as sub-diploid cells (SubG1 population) was correlated with expression levels of GD2 in the cell lines tested (lower panel). R2 value as determined by the two order polynomial regression is indicated. The results presented are representative of those obtained in three independent experiments. (C) HTB63 cells were incubated with mAb 3F8 (50 μg/ml). mAb HO-1 was used as an isotype matched control (Ctrl). Untreated cells (Medium) and Jurkat cells treated with etoposide were used as a background and as a positive control for caspase 9 induction (Ctrl +), respectively. Following an incubation at 37°C in a 5% CO2 atmosphere for the indicated times, cells were harvested and lysed. Cell lysates were analyzed by protein gel blot with the indicated mAbs. Calnexin was used as a loading control. The data shown are representative of the results obtained in three independent experiments. (D) HTB63 and M21 cells were incubated with mAb 3F8 (3F8) (50 μg/ml). Following an up to 24 h incubation at 37°C in a 5% CO2 atmosphere enzymatic activity of activated caspase 3/7 in the cells was measured by Apo-ONE® Homogeneous Caspase 3/7 Assay. Data are expressed as mean ± SD of the results obtained in three independent experiments. (E) HTB63 cells were pre-incubated with 40 μM of the Pan-caspase inhibitor Boc-D-FMK, caspase 3 inhibitor Z-DQMD-FMK, caspase 8 inhibitor Z-IETD-FMK or caspase 9 inhibitor Z-LEHD-FMK. Following a 60 min incubation at 37°C in a 5% CO2 atmosphere cells were then incubated with mAb 3F8 (50 μg/ml). Following a 24 h incubation at 37°C in a 5% CO2 atmosphere apoptosis induction was determined by PI staining. Percentages of apoptotic cells detected as sub-diploid cells (SubG1 population) are shown. Data are expressed as mean ± SD of the results obtained in three independent experiments.

Figure 3. Changes in intrinsic caspase-dependent and caspase-independent apoptotic pathways induced by GD2-specific mAb 3F8 in human melanoma cells. (A) HTB63 cells were seeded in flat bottom six-well plates (2 × 10⁵/well) and incubated with mAb 3F8 (50 μg/ml). mAb HO-1 was used as an isotype matched control (Ctrl). Untreated cells were used as a background control. Following an up to 6 h incubation at 37°C in a 5% CO2 atmosphere, mitochondria permeability was determined by 5,5′,6,6′-tetrachloro-1,1′,3,3′-tetraethylbenzimidazolcarbocyanine iodide (JC-1) staining. Green fluorescence intensity of JC-1 in cells was measured by flow cytometry. Increase of green fluorescence intensity in cells represents increase in mitochondria permeability. The results presented are representative of those obtained in three independent experiments. (B) Following a 6 h incubation at 37°C in a 5% CO2 atmosphere, cells were harvested and lysed. Cell lysates were analyzed by protein gel blot with the indicated mAbs. mAb HO-1 and staurosporine (0.5 μM) were used as an isotype matched (Ctrl) and as a positive (Ctrl+) control, respectively. Lysate from untreated cells was used as a background control (–). α-tubulin was used as a loading control. The results presented are representative of those obtained in three independent experiments. (C) Following an up to 24 h incubation at 37°C in a 5% CO2 atmosphere, cells were harvested and lysed. Cell lysates were analyzed by protein gel blot with the indicated mAbs. Calnexin was used as a loading control. A representative result is shown (upper panel). The levels of Apaf-1 normalized to calnexin are plotted and expressed as mean ± SD of the results obtained in three independent experiments (lower panel). (D) Following an incubation at 37°C in a 5% CO2 atmosphere for the indicated times, cells were harvested and lysed. Cell lysates were analyzed by protein gel blot with the indicated mAbs. Calnexin was used as a loading control. Lysate from untreated cells was used as a background control. The results presented are representative of those obtained in three independent experiments. (E) Following a 24 h incubation at 37°C in a 5% CO2 atmosphere, cells were harvested and lysed. Cell lysates were analyzed by protein gel blot with the indicated mAbs. Calnexin was used as a loading control. The results presented are representative of those obtained in three independent experiments.
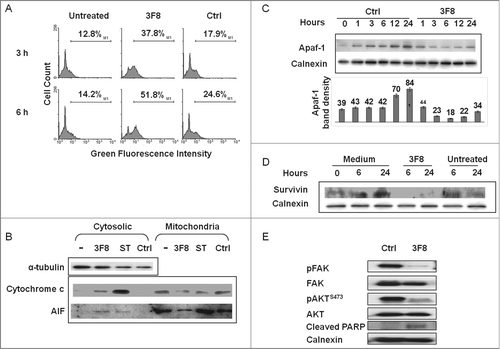
Figure 3. Changes in intrinsic caspase-dependent and caspase-independent apoptotic pathways induced by GD2-specific mAb 3F8 in human melanoma cells. (A) HTB63 cells were seeded in flat bottom six-well plates (2 × 10⁵/well) and incubated with mAb 3F8 (50 μg/ml). mAb HO-1 was used as an isotype matched control (Ctrl). Untreated cells were used as a background control. Following an up to 6 h incubation at 37°C in a 5% CO2 atmosphere, mitochondria permeability was determined by 5,5′,6,6′-tetrachloro-1,1′,3,3′-tetraethylbenzimidazolcarbocyanine iodide (JC-1) staining. Green fluorescence intensity of JC-1 in cells was measured by flow cytometry. Increase of green fluorescence intensity in cells represents increase in mitochondria permeability. The results presented are representative of those obtained in three independent experiments. (B) Following a 6 h incubation at 37°C in a 5% CO2 atmosphere, cells were harvested and lysed. Cell lysates were analyzed by protein gel blot with the indicated mAbs. mAb HO-1 and staurosporine (0.5 μM) were used as an isotype matched (Ctrl) and as a positive (Ctrl+) control, respectively. Lysate from untreated cells was used as a background control (–). α-tubulin was used as a loading control. The results presented are representative of those obtained in three independent experiments. (C) Following an up to 24 h incubation at 37°C in a 5% CO2 atmosphere, cells were harvested and lysed. Cell lysates were analyzed by protein gel blot with the indicated mAbs. Calnexin was used as a loading control. A representative result is shown (upper panel). The levels of Apaf-1 normalized to calnexin are plotted and expressed as mean ± SD of the results obtained in three independent experiments (lower panel). (D) Following an incubation at 37°C in a 5% CO2 atmosphere for the indicated times, cells were harvested and lysed. Cell lysates were analyzed by protein gel blot with the indicated mAbs. Calnexin was used as a loading control. Lysate from untreated cells was used as a background control. The results presented are representative of those obtained in three independent experiments. (E) Following a 24 h incubation at 37°C in a 5% CO2 atmosphere, cells were harvested and lysed. Cell lysates were analyzed by protein gel blot with the indicated mAbs. Calnexin was used as a loading control. The results presented are representative of those obtained in three independent experiments.

Figure 4. Internalization of GD2-specific mAb and increase of GD2 in endosomes in human melanoma cells incubated with GD2-specific mAb 3F8. (A) HTB63 cells (2 × 10⁵/well) were seeded and grown on glass coverslips in flat bottom six-well plates and incubated with Alexa Fluor 488 labeled mAb 3F8 (50 μg/ml) (3F8*). Alexa Fluor 488 labeled mAb 763.74 (50 μg/ml) (Ctrl*) was used as an irrelevant antibody control. Following a 3 h incubation at 37°C in a 5% CO2 atmosphere, internalization of mAb 3F8 was determined by overlapping the confocal microscopy images of green fluorescence (Alexa Fluor 488 labeled mAb 3F8), and red fluorescence (endosomal marker, Rab 5). The results presented are representative of those obtained in two independent experiments. (B and C) HTB63 cells were incubated with mAb 3F8 (3F8) (50 μg/ml). CSPG4-specific mAb 763.74 (50 μg/ml) was used as a specificity control (Ctrl). Following a 3 h incubation at 37°C in a 5% CO2 atmosphere, cells were harvested and intracellularly stained with Alexa Fluor 488 labeled GD2-specific mAb. Increase of GD2 containing endosomes (yellow color) in HTB63 cells was determined by overlapping the confocal microscopy images of green fluorescence (GD2-specific mAb) and red fluorescence (endosomal marker, Rab 5). The results presented are representative of those obtained in three independent experiments (B). Overlapped confocal microscopy images were analyzed by ImageJ software for the increase of GD2 containing endosomes (yellow particles). Data are expressed as mean of GD2 containing endosomes per 100 cells ± SD of the results obtained in three independent experiments (C).
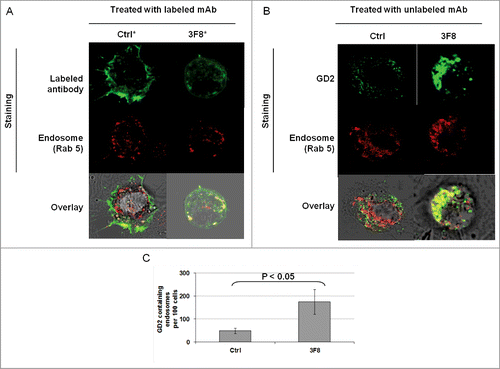
Figure 4. Internalization of GD2-specific mAb and increase of GD2 in endosomes in human melanoma cells incubated with GD2-specific mAb 3F8. (A) HTB63 cells (2 × 10⁵/well) were seeded and grown on glass coverslips in flat bottom six-well plates and incubated with Alexa Fluor 488 labeled mAb 3F8 (50 μg/ml) (3F8*). Alexa Fluor 488 labeled mAb 763.74 (50 μg/ml) (Ctrl*) was used as an irrelevant antibody control. Following a 3 h incubation at 37°C in a 5% CO2 atmosphere, internalization of mAb 3F8 was determined by overlapping the confocal microscopy images of green fluorescence (Alexa Fluor 488 labeled mAb 3F8), and red fluorescence (endosomal marker, Rab 5). The results presented are representative of those obtained in two independent experiments. (B and C) HTB63 cells were incubated with mAb 3F8 (3F8) (50 μg/ml). CSPG4-specific mAb 763.74 (50 μg/ml) was used as a specificity control (Ctrl). Following a 3 h incubation at 37°C in a 5% CO2 atmosphere, cells were harvested and intracellularly stained with Alexa Fluor 488 labeled GD2-specific mAb. Increase of GD2 containing endosomes (yellow color) in HTB63 cells was determined by overlapping the confocal microscopy images of green fluorescence (GD2-specific mAb) and red fluorescence (endosomal marker, Rab 5). The results presented are representative of those obtained in three independent experiments (B). Overlapped confocal microscopy images were analyzed by ImageJ software for the increase of GD2 containing endosomes (yellow particles). Data are expressed as mean of GD2 containing endosomes per 100 cells ± SD of the results obtained in three independent experiments (C).

Figure 5. Association of apoptosis induction with GD2-specific mAb internalization and increase in GD2-containing endosomes in human melanoma cells incubated with GD2-specific mAb 3F8. (A) HTB63 cells (2 × 10⁵/well) were seeded and grown on glass cover slips in flat bottom six-well plates and incubated with Alexa Fluor 488 labeled GD2-specific mAb 3F8 (50 μg/ml) (3F8*). Alexa Fluor 488 labeled F(ab’)2 fragments of mAb 3F8 (50 μg/ml) (Ctrl-*) was used as a negative antibody control. Following a 3 h incubation at 37°C in a 5% CO2 atmosphere, internalization of GD2-specific mAb 3F8 was determined by overlapping the confocal microscopy images of green fluorescence (GD2-specific mAb 3F8) and red fluorescence (endosomal marker, Rab 5). The results presented are representative of those obtained in three independent experiments. (B and C) HTB63 cells were incubated with mAb 3F8 (3F8) (50 μg/ml). F(ab’)2 fragments of mAb 3F8 (50 μg/ml) were used as a negative antibody control (Ctrl). Following a 3 h incubation at 37°C in a 5% CO2 atmosphere, cells were intracellularly stained with Alexa Fluor 488 labeled GD2-specific mAb. Increase of GD2 containing endosomes (yellow color) in HTB63 cells was determined by overlapping the confocal microscopy images of green fluorescence (GD2-specific mAb) and red fluorescence (endosomal marker, Rab 5) (B). The results presented are representative of those obtained in three independent experiments. Overlapped confocal microscopy images were analyzed by ImageJ software for the increase of GD2 containing endosomes (yellow particles). Data are expressed as mean of GD2 containing endosomes per 100 cells ± SD of the results obtained in three independent experiments (C). (D) HTB63 cells were incubated with mAb 3F8 (50 μg/ml). Following a 24 h incubation at 37°C in a 5% CO2atmosphere, induction of apoptosis was determined by intracellular PI-staining. F(ab’)2 fragments of mAb 3F8 were used as a negative antibody control (Ctrl-). mAb HO-1 was used as an isotype matched control (Ctrl). The results presented are representative of those obtained in three independent experiments.
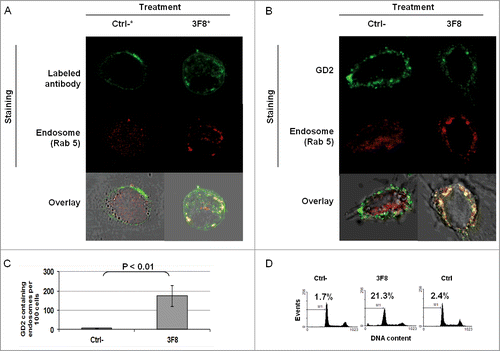
Figure 5. Association of apoptosis induction with GD2-specific mAb internalization and increase in GD2-containing endosomes in human melanoma cells incubated with GD2-specific mAb 3F8. (A) HTB63 cells (2 × 10⁵/well) were seeded and grown on glass cover slips in flat bottom six-well plates and incubated with Alexa Fluor 488 labeled GD2-specific mAb 3F8 (50 μg/ml) (3F8*). Alexa Fluor 488 labeled F(ab’)2 fragments of mAb 3F8 (50 μg/ml) (Ctrl-*) was used as a negative antibody control. Following a 3 h incubation at 37°C in a 5% CO2 atmosphere, internalization of GD2-specific mAb 3F8 was determined by overlapping the confocal microscopy images of green fluorescence (GD2-specific mAb 3F8) and red fluorescence (endosomal marker, Rab 5). The results presented are representative of those obtained in three independent experiments. (B and C) HTB63 cells were incubated with mAb 3F8 (3F8) (50 μg/ml). F(ab’)2 fragments of mAb 3F8 (50 μg/ml) were used as a negative antibody control (Ctrl). Following a 3 h incubation at 37°C in a 5% CO2 atmosphere, cells were intracellularly stained with Alexa Fluor 488 labeled GD2-specific mAb. Increase of GD2 containing endosomes (yellow color) in HTB63 cells was determined by overlapping the confocal microscopy images of green fluorescence (GD2-specific mAb) and red fluorescence (endosomal marker, Rab 5) (B). The results presented are representative of those obtained in three independent experiments. Overlapped confocal microscopy images were analyzed by ImageJ software for the increase of GD2 containing endosomes (yellow particles). Data are expressed as mean of GD2 containing endosomes per 100 cells ± SD of the results obtained in three independent experiments (C). (D) HTB63 cells were incubated with mAb 3F8 (50 μg/ml). Following a 24 h incubation at 37°C in a 5% CO2atmosphere, induction of apoptosis was determined by intracellular PI-staining. F(ab’)2 fragments of mAb 3F8 were used as a negative antibody control (Ctrl-). mAb HO-1 was used as an isotype matched control (Ctrl). The results presented are representative of those obtained in three independent experiments.

Figure 6. Proposed apoptotic pathways triggered by GD2-specific mAb 3F8. Following the internalization of both mAb 3F8 and GD2 into endosomes, the increase of GD2 containing endosomes triggers both extrinsic and intrinsic caspase-dependent and caspase-independent apoptotic pathways. They include the activation of caspase 3, 7, and 8, the release of cyt c and AIF, and the downregulation of both survivin and Apaf-1 without the activation of caspase 9. Apaf-1 downregulation is believed to be responsible for the lack of detectable caspase 9 activation. Survivin downregulation is believed to increase the sensitivity of cells to both caspase-dependent and caspase-independent apoptosis. Solid lines indicate the direct effects while dash lines indicate effects with either unknown or indirect mechanisms.
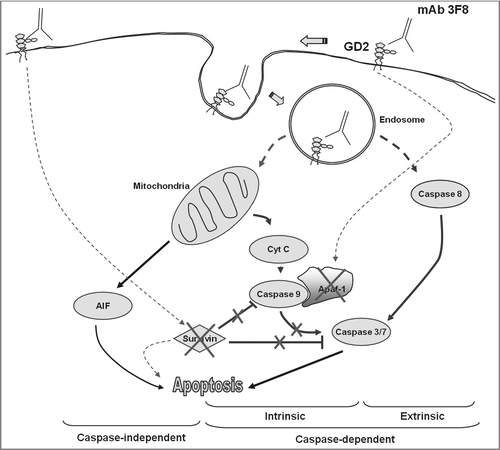
Figure 6. Proposed apoptotic pathways triggered by GD2-specific mAb 3F8. Following the internalization of both mAb 3F8 and GD2 into endosomes, the increase of GD2 containing endosomes triggers both extrinsic and intrinsic caspase-dependent and caspase-independent apoptotic pathways. They include the activation of caspase 3, 7, and 8, the release of cyt c and AIF, and the downregulation of both survivin and Apaf-1 without the activation of caspase 9. Apaf-1 downregulation is believed to be responsible for the lack of detectable caspase 9 activation. Survivin downregulation is believed to increase the sensitivity of cells to both caspase-dependent and caspase-independent apoptosis. Solid lines indicate the direct effects while dash lines indicate effects with either unknown or indirect mechanisms.
Supplemental material

supplementary.zip

Download Zip (75.5 KB)

Reprints and Corporate Permissions

Please note: Selecting permissions does not provide access to the full text of the article, please see our help page How do I view content?

To request a reprint or corporate permissions for this article, please click on the relevant link below:

Academic Permissions

Please note: Selecting permissions does not provide access to the full text of the article, please see our help page How do I view content?

Obtain permissions instantly via Rightslink by clicking on the button below:

If you are unable to obtain permissions via Rightslink, please complete and submit this Permissions form. For more information, please visit our Permissions help page.