1,419
Views
28
CrossRef citations to date
0
Altmetric
Original Research

Lectin-like transcript 1 is a marker of germinal center-derived B-cell non-Hodgkin's lymphomas dampening natural killer cell functions

, , , , , , , , , , , , , , , & show all
Article: e1026503 | Received 13 Nov 2014, Accepted 27 Feb 2015, Published online: 30 Jun 2015

Figures & data

Figure 1 (See previous page). Predominant expression of LLT1 in B cells from germinal centers. (A) IHC staining of FFPE sections from human tonsils (top panel) and human reactive lymph nodes (bottom panel) with hematoxylin (HE), isotype control or anti-LLT1 (clone 2F1). (B) Double immunofluorescence staining of FFPE tonsil sections using anti-CD20 or anti-LLT1 (clone 2F1) and colocalization together with Hoechst staining of nucleus. Top panel shows GC, mantel cell, and interfollicular (IFZ) zones and bottom panel shows GC B cells at higher magnification (A–B) show GCs (arrows) surrounded by mantle cell zone (filled stars) and IFZ (empty stars). Data are representative of 4 to 12 independent experiments. (C) Frequency among B and T cells in PBMCs and tonsils from flow cytometry analysis. n = 10, ****, p < 0.0001 Mann–Whitney U-test. (D) LLT1 detection by protein gel blot using anti-LLT1 (clone 2F1) in whole cell lysates of the indicated cells, digested or not with Endo H. β-actin is used as an internal control. Two differentially glycosylated forms of LLT1 are visualized: Endo H resistant form (black arrow) and Endo H sensitive form yielding two bands (white arrows 1 and 2). Data are representative of 2 independent experiments. (E–I) Multiparameter flow cytometry analysis of LLT1 expression. (E) Representative flow cytometry staining using anti-LLT1 (clone 4F68). (F) Representative expression of LLT1 and (G) frequency on gated CD19+ B cells analyzed according to CD38 expression. n =7, ***, p< 0.001 Mann–Whitney U-test. (H) Distribution of centroblast (CB) and centrocyte (CC) populations within CD19+ CD38+ and LLT1+ CD19+CD38+ gated tonsil cells according to the expression of CXCR4 and CD83. Citation35,36 (I) Scheme of the differentiation stages of mature B-cell development adapted from. Citation34 Each stage of B cell differentiation is visualized in the rectangles in the dot-plots below. Cells (gray dots) were gated using the markers indicated above each dot-plot and displayed according to markers on the dot-plot axis. On these dot-plots, an overlay of the gated CD3CD19+LLT1+ B cells is shown and LLT1+ cells are visualized as black dots. (E–F–H–I) Data are representative of 3–6 independent experiments.
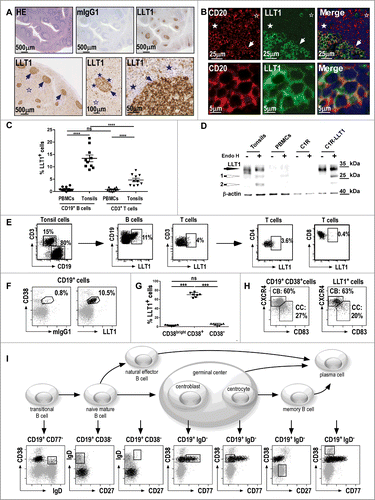
Figure 1 (See previous page). Predominant expression of LLT1 in B cells from germinal centers. (A) IHC staining of FFPE sections from human tonsils (top panel) and human reactive lymph nodes (bottom panel) with hematoxylin (HE), isotype control or anti-LLT1 (clone 2F1). (B) Double immunofluorescence staining of FFPE tonsil sections using anti-CD20 or anti-LLT1 (clone 2F1) and colocalization together with Hoechst staining of nucleus. Top panel shows GC, mantel cell, and interfollicular (IFZ) zones and bottom panel shows GC B cells at higher magnification (A–B) show GCs (arrows) surrounded by mantle cell zone (filled stars) and IFZ (empty stars). Data are representative of 4 to 12 independent experiments. (C) Frequency among B and T cells in PBMCs and tonsils from flow cytometry analysis. n = 10, ****, p < 0.0001 Mann–Whitney U-test. (D) LLT1 detection by protein gel blot using anti-LLT1 (clone 2F1) in whole cell lysates of the indicated cells, digested or not with Endo H. β-actin is used as an internal control. Two differentially glycosylated forms of LLT1 are visualized: Endo H resistant form (black arrow) and Endo H sensitive form yielding two bands (white arrows 1 and 2). Data are representative of 2 independent experiments. (E–I) Multiparameter flow cytometry analysis of LLT1 expression. (E) Representative flow cytometry staining using anti-LLT1 (clone 4F68). (F) Representative expression of LLT1 and (G) frequency on gated CD19+ B cells analyzed according to CD38 expression. n =7, ***, p< 0.001 Mann–Whitney U-test. (H) Distribution of centroblast (CB) and centrocyte (CC) populations within CD19+ CD38+ and LLT1+ CD19+CD38+ gated tonsil cells according to the expression of CXCR4 and CD83. Citation35,36 (I) Scheme of the differentiation stages of mature B-cell development adapted from. Citation34 Each stage of B cell differentiation is visualized in the rectangles in the dot-plots below. Cells (gray dots) were gated using the markers indicated above each dot-plot and displayed according to markers on the dot-plot axis. On these dot-plots, an overlay of the gated CD3−CD19+LLT1+ B cells is shown and LLT1+ cells are visualized as black dots. (E–F–H–I) Data are representative of 3–6 independent experiments.

Figure 2. CD161+ NK and T cells in tonsils. (A–B) IHC staining of frozen tissue sections from human tonsils with the indicated (A) anti-CD161 mAbs, and (B) anti-NKp46 and anti-CD3 mAbs. (C) Double IF staining of the IFZ on tonsil frozen tissue sections using anti-CD3 and anti-CD161. (D, E) Multiparameter flow cytometry analysis of CD161 expression. Representative expression of CD161 in CD56+CD3NK cells and subsets of T cells (D), including TFH (E). Data are representative of 3 independent experiments.
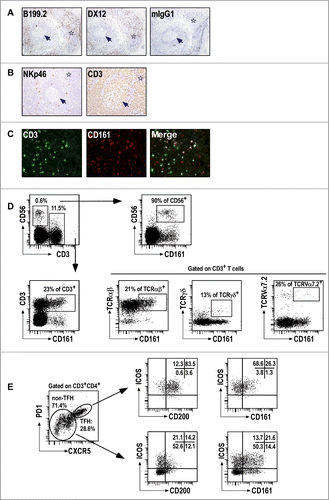
Figure 2. CD161+ NK and T cells in tonsils. (A–B) IHC staining of frozen tissue sections from human tonsils with the indicated (A) anti-CD161 mAbs, and (B) anti-NKp46 and anti-CD3 mAbs. (C) Double IF staining of the IFZ on tonsil frozen tissue sections using anti-CD3 and anti-CD161. (D, E) Multiparameter flow cytometry analysis of CD161 expression. Representative expression of CD161 in CD56+CD3−NK cells and subsets of T cells (D), including TFH (E). Data are representative of 3 independent experiments.

Figure 3. LLT1 expression in B lymphoma cell lines. (A–B) CLEC2D transcript variant 1 coding for LLT1 quantified by real-time RT-PCR in the indicated cell lines, summarized in (A) and expressed relative to β-actin in (B). Statistical significance against LLT1 C1R cells was calculated n = 4 to 30, ***, p < 0.001, **, p< 0.01, Mann–Whitney U-test. (A–B) Data are representative of 3 independent experiments. (C–D) LLT1 expression detected by protein gel blot analysis of whole cell lysates digested or not with Endo H using anti-LLT1 mAb (clone 2F1). β-actin is used as an internal control. Two differentially glycosylated forms of LLT1 are visualized: Endo H resistant form (black arrow) and Endo H sensitive form (white arrows 1 and 2). Data are representative of 3 experiments. (E) LLT1 cell surface expression monitored by flow cytometry with anti-LLT1 mAb (clone 4F68) compared to isotype mIgG1 control and anti-MHC class I mAb (clone DX17). Data are representative of 8 independent experiments.
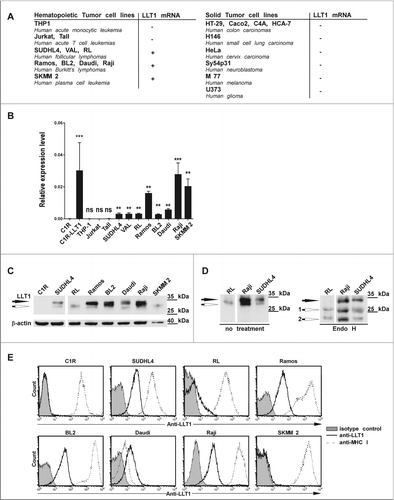
Figure 3. LLT1 expression in B lymphoma cell lines. (A–B) CLEC2D transcript variant 1 coding for LLT1 quantified by real-time RT-PCR in the indicated cell lines, summarized in (A) and expressed relative to β-actin in (B). Statistical significance against LLT1− C1R cells was calculated n = 4 to 30, ***, p < 0.001, **, p< 0.01, Mann–Whitney U-test. (A–B) Data are representative of 3 independent experiments. (C–D) LLT1 expression detected by protein gel blot analysis of whole cell lysates digested or not with Endo H using anti-LLT1 mAb (clone 2F1). β-actin is used as an internal control. Two differentially glycosylated forms of LLT1 are visualized: Endo H resistant form (black arrow) and Endo H sensitive form (white arrows 1 and 2). Data are representative of 3 experiments. (E) LLT1 cell surface expression monitored by flow cytometry with anti-LLT1 mAb (clone 4F68) compared to isotype mIgG1 control and anti-MHC class I mAb (clone DX17). Data are representative of 8 independent experiments.

Figure 4. LLT1 expression in primary B-cell NHLs. (A–H) Representative IHC staining with anti-LLT1 mAb (clone 2F1) of lymph node biopsies from patients: (A) gastric marginal B-cell lymphoma (MALT type); (B) Burkitt lymphoma; (C–E) low grade follicular lymphoma; (F) high grade follicular lymphoma; (G) Diffuse large B-cell lymphoma of GC type and (H) DLBCL of activated B-cell type. (C–E) Of note, the level of expression in low grade FL appears heterogenous within the neoplastic follicles (arrows) due to a stronger expression in centroblasts than in centrocytes. Accordingly, the expression appears higher in high grade FL (F) than in low grade FL (C–E). (I) LLT1 cell surface expression on the indicated primary NHLs monitored by flow cytometry with anti-LLT1 (clone 4F68). (J) Summary of immunohistochemical analysis of LLT1 expression in lymphoid neoplasms.
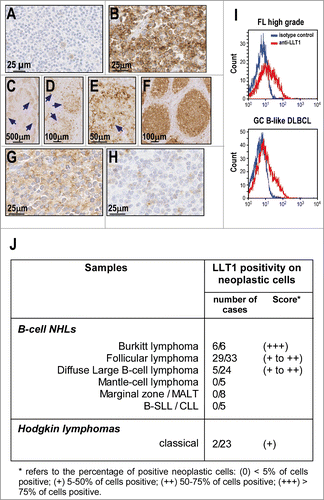
Figure 4. LLT1 expression in primary B-cell NHLs. (A–H) Representative IHC staining with anti-LLT1 mAb (clone 2F1) of lymph node biopsies from patients: (A) gastric marginal B-cell lymphoma (MALT type); (B) Burkitt lymphoma; (C–E) low grade follicular lymphoma; (F) high grade follicular lymphoma; (G) Diffuse large B-cell lymphoma of GC type and (H) DLBCL of activated B-cell type. (C–E) Of note, the level of expression in low grade FL appears heterogenous within the neoplastic follicles (arrows) due to a stronger expression in centroblasts than in centrocytes. Accordingly, the expression appears higher in high grade FL (F) than in low grade FL (C–E). (I) LLT1 cell surface expression on the indicated primary NHLs monitored by flow cytometry with anti-LLT1 (clone 4F68). (J) Summary of immunohistochemical analysis of LLT1 expression in lymphoid neoplasms.

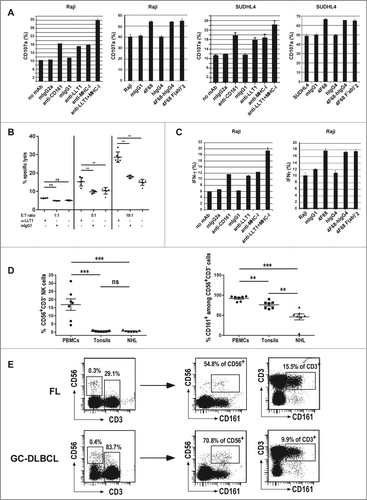
Figure 5 (See previous page). LLT1 expression by B-cell lymphoma inhibits NK cell functions. Polyclonal NK cells were incubated with the following lymphoma cell lines (A, C) Raji, (A,B) SUDHL4 in the presence or absence of blocking mAbs as indicated. (A) NK cell degranulation assessed by expression of CD107a on the cell surface. (B) NK cell cytotoxicity toward SUDHL4 in the presence or absence of indicated antibodies. n = 3 to 6, **, p < 0.01 Mann–Whitney U-test. (C) Intracellular secretion of IFNγ detected by flow cytometry staining. (A, C) Data are representative of 3 to 6 independent experiments. (D) Frequency of CD56+CD3NK cells (left panel) and CD161+ cells among NK cells (right panel) in PBMCs, tonsils and NHL patients including 4 FL and 3 GC-DLBCL. n = 7, ***, p< 0.001, **, p< 0.01, Mann–Whitney U-test. (E) Representative expression of CD161 in CD56+CD3NK cells and CD3+ T cells.

Figure 5 (See previous page). LLT1 expression by B-cell lymphoma inhibits NK cell functions. Polyclonal NK cells were incubated with the following lymphoma cell lines (A, C) Raji, (A,B) SUDHL4 in the presence or absence of blocking mAbs as indicated. (A) NK cell degranulation assessed by expression of CD107a on the cell surface. (B) NK cell cytotoxicity toward SUDHL4 in the presence or absence of indicated antibodies. n = 3 to 6, **, p < 0.01 Mann–Whitney U-test. (C) Intracellular secretion of IFNγ detected by flow cytometry staining. (A, C) Data are representative of 3 to 6 independent experiments. (D) Frequency of CD56+CD3−NK cells (left panel) and CD161+ cells among NK cells (right panel) in PBMCs, tonsils and NHL patients including 4 FL and 3 GC-DLBCL. n = 7, ***, p< 0.001, **, p< 0.01, Mann–Whitney U-test. (E) Representative expression of CD161 in CD56+CD3−NK cells and CD3+ T cells.
Supplemental material

supplementary_file.doc

Download MS Word (1.1 MB)

Reprints and Corporate Permissions

Please note: Selecting permissions does not provide access to the full text of the article, please see our help page How do I view content?

To request a reprint or corporate permissions for this article, please click on the relevant link below:

Academic Permissions

Please note: Selecting permissions does not provide access to the full text of the article, please see our help page How do I view content?

Obtain permissions instantly via Rightslink by clicking on the button below:

If you are unable to obtain permissions via Rightslink, please complete and submit this Permissions form. For more information, please visit our Permissions help page.