Figures & data
Figure 1. ECDFs of the (normalized) orders of immune escape genes in transcriptomes from FL and DLBCL biopsies. Each plot represents the appearance order of the IEGS genes in transcriptomes from the specified cell type (depicted as ECDF). The ECDFs of a random gene set show similar random distributions in transcriptomes from normal B cell controls (blue: mean from n = 20 samples) or FL cells (red: mean from n = 38 samples) (A), unlike the ECDFs of the IEGS which evidence a significantly up-regulated expression in the FL samples (red) compared to the normal B cell controls (blue) (B). The distribution of a random gene set is uniform and not different in transcriptomes from normal B cells (blue) and DLBCL cells (red)(C), while that of IEGS shows significant upregulation in the transcriptomes from DLBCL samples when compared to the normal B cell controls (red curve: mean from n = 73 DLBCL samples) from the same study (D) (p values for lymphoma vs. normal group comparisons) (data for A–D comes from the NCBI GEO dataset GSE12195Citation29). The ECDF plots for control human tissues show no upregulation of the IEGS (E) in lymph nodes, tonsils, spleen, skin, kidney, pancreas, colon and breast (means from n = 3–9 samples, p values for tissue vs. diagonal), (NCBI GEO data set GSE7307Citation31). ECDFs of the IEGS from individual samples (F) of normal B cell controls (n = 20), FL biopsies (n = 38), DLBCL biopsies (n = 73) (GEO dataset GSE12195Citation29), multiple myeloma (MM, n = 12) (NCBI GEO data set GSE6691Citation33), and chronic lymphocytic leukemia (CLL, n = 188) (NCBI GEO dataset GSE31048Citation32).
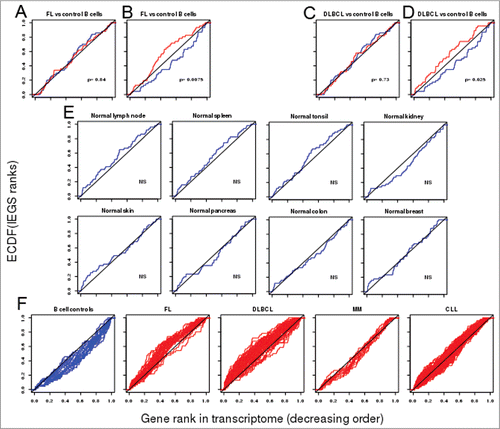
Table 1. List of 54 genes of IEGS
Figure 2. IHC of immune escape markers expressed by FL. (A and B) Classical H&E stainings of FL biopsies (A: FL grades 1–2, ×100, B: FL grade 3, ×100) reveal small and atypical lymphoid cells with a round nucleus and an irregular membrane. (C–H) Representative IHC of FL samples stained for: PD-1 (C: ×100, D: ×200); PD-L1 (E: ×100, F: ×40), PD-L2 (G: ×100), and LAG3 (H: ×100).
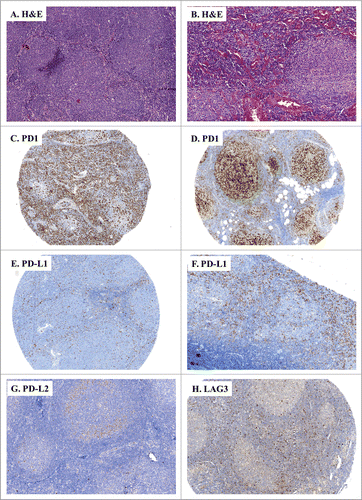
Table 2. Clinical characteristics of FL and DLBCL patients
Figure 3. IHC of immune escape markers expressed by DLBCL. (A and B) Classical H&E stainings of DLBCL biopsies (A: ×200, B: ×100) reveal large-sized and atypical lymphoid cells harbouring a round nucleus and an irregular membrane. (C–H) Representative IHC of DLBCL samples stained for: PD-1 (C: ×100, D: ×200); PD-L1 (E: ×100, F: ×150), PD-L2 (G: ×100), and LAG3 (H: ×100).
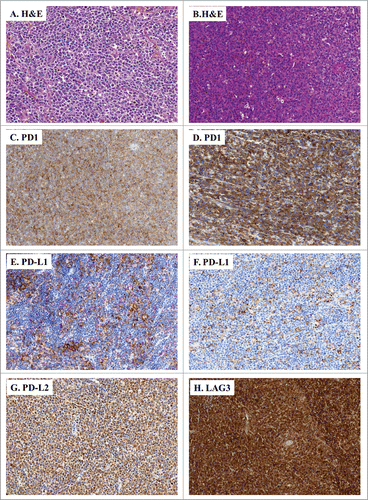
Figure 4. Rates of lymphoma cells expressing immune escape markers in DLBCL and FL biopsies. (A–D) Shown are the rates of tumor cells found positive for the specified IHC stainings upon visual examination of the FL (n = 27) and DLBCL (n = 27) samples: PD-1+ (A), PD-L1+ (B), PD-L2+ (C), LAG3+ (D). * indicates significant differences between groups (p = 0.01; p = 0.0003; p = 0.0002; p = 0.003, respectively), Wilcoxon–Mann–Whitney tests.
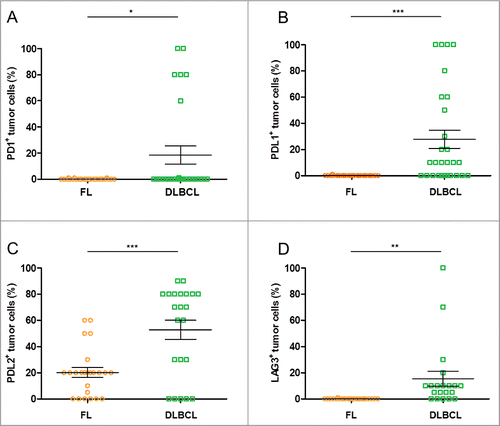
Figure 5. Rates of infiltrated immune cells expressing immune escape markers in control samples and DLBCL and FL biopsies. (A–D) Shown are the rates of immune cell infiltrates found to be positive for the specified stainings upon visual examination of the FL (n = 27), DLBCL (n = 27) and control tonsil samples (n = 9): PD-1+ (A), PD-L1+ (B), PD-L2+ (C), LAG3+ (D). * indicates significant differences between groups (p < 0.0001; p = 0.02; p = 0.03; p = 0.1355, respectively), Wilcoxon–Mann–Whitney tests.
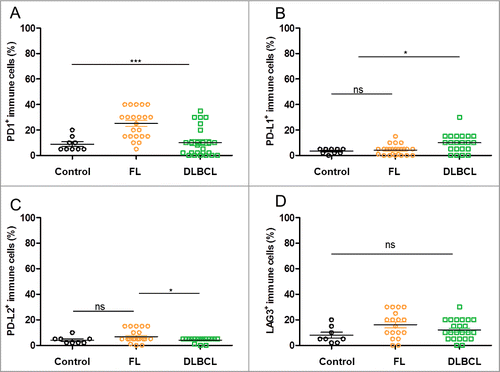
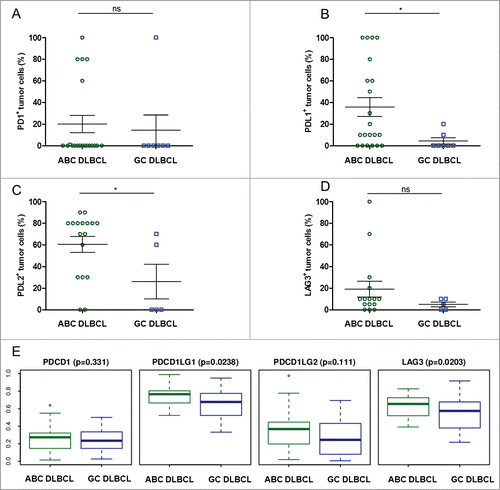
Figure 6. Proportion of tumor cells expressing immune escape markers in ABC- and GC-type DLBCL. (A–D) Shown are the rates of tumor cells found to be positive for the specified stainings upon visual examination of the ABC (n = 20) and GC (n = 7) DLBCL samples: PD-1+ (A), PD-L1+ (B), PD-L2+ (C), LAG3+ (D). * indicates significant differences between groups (p = 0.7; p = 0.04; p = 0.04; p = 0.29, respectively), Wilcoxon–Mann–Whitney tests. (E) Boxplot for normalized mRNA expression of the PD-1 gene PDCD1, the PD-L1 gene CD274, the PD-L2 gene PDCD1LG2, and the LAG3 gene in published transcriptomes from GC and ABC subtypes of DLBCL samples,Citation29 p values for ABC vs. GC obtained from Wilcoxon–Mann–Whitney tests.