4,023
Views
221
CrossRef citations to date
0
Altmetric
Original Research

Hypoxic tumor-derived microvesicles negatively regulate NK cell function by a mechanism involving TGF-β and miR23a transfer

, , , , , , , , , & show all
Article: e1062968 | Received 20 Mar 2015, Accepted 10 Jun 2015, Published online: 08 Apr 2016

Figures & data

Figure 1. Characterization of normoxic and hypoxic tumor-derived microvesicles (MVs). (A) Transmission electron microscopy analysis of the shape of normoxic and hypoxic MVs derived from IGR-Heu and K562 tumor cells. (B) Analysis of the size range of normoxic and hypoxic MVs derived from IGR-Heu and K562 tumor cells determined by Tunable Resistive Pulse Sensing (TRPS) analysis. Results show the percentage of MVs corresponding to each size range. (C) Surface expression of LAMP-1 and MHC-I on normoxic and hypoxic TD-MVs from IGR-Heu and K562 cells. Data are reported as a percentage of positive cells (upper lines) and mean fluorescence intensity (MFI) (lower lines). (D) Analysis of MV uptake by confocal microscopy. Normoxic and hypoxic MVs derived from IGR-Heu and K562 tumor cells were stained with PKH67 (green) and incubated with PKH26-labeled natural killer (NK)-92 cells. Control condition (Ctrl) corresponds to NK-92 cells incubated without MVs. The upper panels represent phase contrast images, the two middle panels represent PHK26 and PKH67-stained NK cells, and the lower panels represent a merge of upper and middle panels and the uptake of PKH67-TD-MVs. Bar: 10 μm.
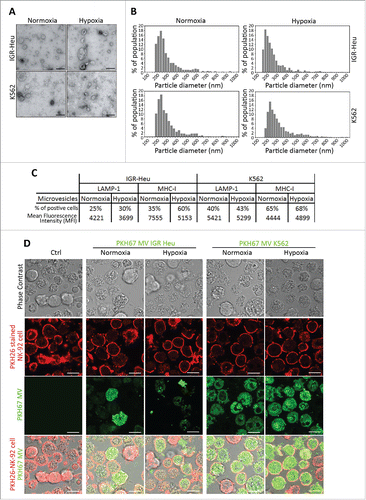
Figure 1. Characterization of normoxic and hypoxic tumor-derived microvesicles (MVs). (A) Transmission electron microscopy analysis of the shape of normoxic and hypoxic MVs derived from IGR-Heu and K562 tumor cells. (B) Analysis of the size range of normoxic and hypoxic MVs derived from IGR-Heu and K562 tumor cells determined by Tunable Resistive Pulse Sensing (TRPS) analysis. Results show the percentage of MVs corresponding to each size range. (C) Surface expression of LAMP-1 and MHC-I on normoxic and hypoxic TD-MVs from IGR-Heu and K562 cells. Data are reported as a percentage of positive cells (upper lines) and mean fluorescence intensity (MFI) (lower lines). (D) Analysis of MV uptake by confocal microscopy. Normoxic and hypoxic MVs derived from IGR-Heu and K562 tumor cells were stained with PKH67 (green) and incubated with PKH26-labeled natural killer (NK)-92 cells. Control condition (Ctrl) corresponds to NK-92 cells incubated without MVs. The upper panels represent phase contrast images, the two middle panels represent PHK26 and PKH67-stained NK cells, and the lower panels represent a merge of upper and middle panels and the uptake of PKH67-TD-MVs. Bar: 10 μm.

Figure 2. The effect of normoxic and hypoxic tumor-derived microvesicles (MVs) on the activity of natural killer (NK) cells. (A) Cytotoxicity of NK cells against tumor cells. NK-92 (upper panels) or NKD (lower panels) cells, untreated (Ctrl) or treated with normoxic (Normoxic MVs) or hypoxic (Hypoxic MVs) MVs derived from IGR-Heu(left panels) or K562 (right panels) cells. Untreated or MV-treated NK cells were co-cultured with IGR-Heu or K562 tumor cells and the percentage of tumor cells lysed was assessed by conventional 4-h 51Cr release assays at different effector: target ratios (30:1, 10:1, or 3:1). Data represent three independent experiments with standard deviation (SD). Statistically significant difference (indicated by asterisks) in NK-mediated lysis between tumor cells incubated with normoxic and hypoxic MVs are shown (*, p < 0.05; **, p < 0.005). (B) The expression of CD107a and IFNγ in NK-92 (left panels) or NKD (right panels) cells, untreated (Ctrl) or treated with MVs as described in A. Data are reported as a percentage of positive cells from three independent experiments with SD. Statistically significant differences (indicated by asterisks) in the expression of CD107a and IFNγ between tumor cells incubated with normoxic and hypoxic MVs are shown (*, p < 0.05; **, p < 0.005; *** p < 0.0005).
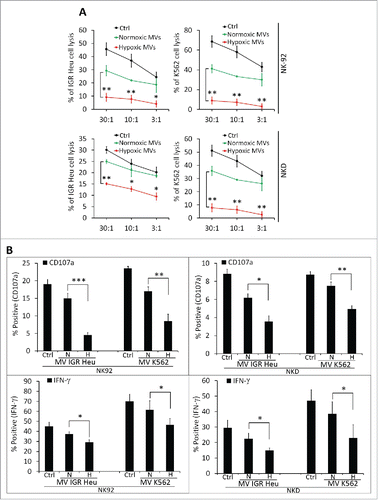
Figure 2. The effect of normoxic and hypoxic tumor-derived microvesicles (MVs) on the activity of natural killer (NK) cells. (A) Cytotoxicity of NK cells against tumor cells. NK-92 (upper panels) or NKD (lower panels) cells, untreated (Ctrl) or treated with normoxic (Normoxic MVs) or hypoxic (Hypoxic MVs) MVs derived from IGR-Heu(left panels) or K562 (right panels) cells. Untreated or MV-treated NK cells were co-cultured with IGR-Heu or K562 tumor cells and the percentage of tumor cells lysed was assessed by conventional 4-h 51Cr release assays at different effector: target ratios (30:1, 10:1, or 3:1). Data represent three independent experiments with standard deviation (SD). Statistically significant difference (indicated by asterisks) in NK-mediated lysis between tumor cells incubated with normoxic and hypoxic MVs are shown (*, p < 0.05; **, p < 0.005). (B) The expression of CD107a and IFNγ in NK-92 (left panels) or NKD (right panels) cells, untreated (Ctrl) or treated with MVs as described in A. Data are reported as a percentage of positive cells from three independent experiments with SD. Statistically significant differences (indicated by asterisks) in the expression of CD107a and IFNγ between tumor cells incubated with normoxic and hypoxic MVs are shown (*, p < 0.05; **, p < 0.005; *** p < 0.0005).

Figure 3. Expression of different natural killer (NK) cell ligands on the surface of tumor cells and their derived microvesicles (MVs). (A) Surface expression of NK ligands at the surface of normoxic or hypoxic IGR-Heu and K562 tumor cells (left) and their derived MVs (right). Data are reported as a percentage of positive cells (upper lines) and mean fluorescence intensity (MFI) (lower lines). (B) Quantification of TGF-β1 in normoxic and hypoxic cells and their derived MVs. IGR-Heu or K562 cells were cultured under normoxia (N) or hypoxia for 24, 48, or 72h. TD-MVs from normoxic (N) or 24h hypoxic (H) tumor cells were isolated as described in the Materials and Methods section. The quantification of TGF-β1 in cells and MVs was performed by ELISA and data were reported as pg of TGF-β1 per mg of cell lysate or MVs. Statistically significant differences (indicated by asterisks) in the level of TGF-β1 between normoxic and hypoxic cells and in their derived MVs are shown (*, p < 0.05; **, p < 0.005; *** p < 0.0005). (C) The expression of NKG2D at the surface of NK cells. NK-92 (upper) or NKD (lower) cells cultured in the absence (Ctrl) or presence of normoxic (N MVs) or hypoxic (H MVs), untreated (−) or pre-treated (+) with anti-TGF-β blocking antibody or with its corresponding isotype. The expression of NKG2D at the surface of NK cells was reported as a percentage of positive cells of three independent experiments with standard deviation. Statistically significant differences (indicated by asterisks) in the expression of NKG2D are shown (*,p < 0.05; **, p < 0.005; *** p < 0.0005).
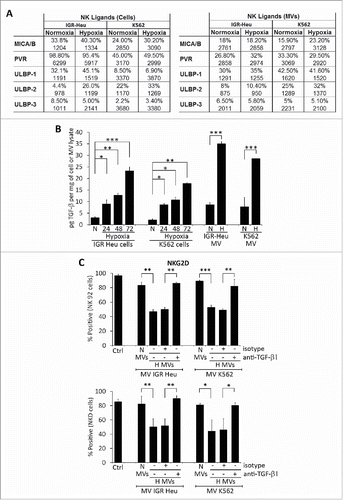
Figure 3. Expression of different natural killer (NK) cell ligands on the surface of tumor cells and their derived microvesicles (MVs). (A) Surface expression of NK ligands at the surface of normoxic or hypoxic IGR-Heu and K562 tumor cells (left) and their derived MVs (right). Data are reported as a percentage of positive cells (upper lines) and mean fluorescence intensity (MFI) (lower lines). (B) Quantification of TGF-β1 in normoxic and hypoxic cells and their derived MVs. IGR-Heu or K562 cells were cultured under normoxia (N) or hypoxia for 24, 48, or 72h. TD-MVs from normoxic (N) or 24h hypoxic (H) tumor cells were isolated as described in the Materials and Methods section. The quantification of TGF-β1 in cells and MVs was performed by ELISA and data were reported as pg of TGF-β1 per mg of cell lysate or MVs. Statistically significant differences (indicated by asterisks) in the level of TGF-β1 between normoxic and hypoxic cells and in their derived MVs are shown (*, p < 0.05; **, p < 0.005; *** p < 0.0005). (C) The expression of NKG2D at the surface of NK cells. NK-92 (upper) or NKD (lower) cells cultured in the absence (Ctrl) or presence of normoxic (N MVs) or hypoxic (H MVs), untreated (−) or pre-treated (+) with anti-TGF-β blocking antibody or with its corresponding isotype. The expression of NKG2D at the surface of NK cells was reported as a percentage of positive cells of three independent experiments with standard deviation. Statistically significant differences (indicated by asterisks) in the expression of NKG2D are shown (*,p < 0.05; **, p < 0.005; *** p < 0.0005).

Figure 4. TGF-β1 blockade in hypoxic tumor-derived microvesicles (MVs) restores NK cell function. (A) Cytotoxicity of NK-92 (left panels) or NKD (right panels) cells against IGR-Heu (upper panels) or K562 (lower panels) tumor cells. NK cells cultured in the absence (Ctrl) or presence of normoxic (MV normoxia) or hypoxic (MV hypoxic) microvesicles (MVs), untreated or pre-incubated with anti-TGF-β1 blocking antibody (+TGF-β1) or its corresponding isotype (+Isotype). Untreated or MV-treated NK cells were co-cultured with IGR-Heu or K562 tumor cells and the percentage of tumor cell lysis was assessed as described in . A statistically significant differences (indicated by asterisks) in NK-mediated lysis between hypoxic tumor cells treated with isotype or TGF-β1 blocking antibody are shown (*, p < 0.05; **, p < 0.005; ***, p < 0.0005; ns, not significant). (B) Effect of blocking TGF-β on the expression of IFNγ by NK cells. The expression of intracytoplasmic IFNγ in NK-92 (upper panel) or NKD (lower panel) cells, cultured in the absence (Ctrl) or presence of normoxic (N) or hypoxic (H) MVs, untreated (−) or pre-treated (+) with anti-TGF-β1 blocking antibody or its corresponding isotype. Data are reported as a percentage of positive cells of three independent experiments with standard deviation. Statistically significant differences (indicated by asterisks) in the percentage of IFNγ positive cells are shown (*, p < 0.05; **, p < 0.005). (C) Effect of blocking TGF-β1 on the secretion of IFNγ by NK cells. The quantification of IFNγ was performed by ELISA on NK-92 (upper panel) or NKD (lower panel) cells described in B. Data are reported as pg IFNγ/mL. Statistically significant differences (indicated by asterisks) in the amount of IFNγ are shown (*,p < 0.05; **, p < 0.005).
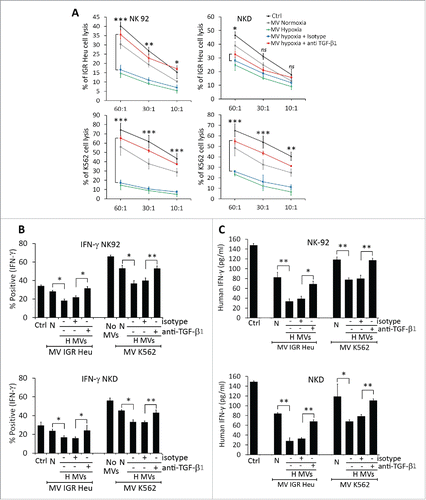
Figure 4. TGF-β1 blockade in hypoxic tumor-derived microvesicles (MVs) restores NK cell function. (A) Cytotoxicity of NK-92 (left panels) or NKD (right panels) cells against IGR-Heu (upper panels) or K562 (lower panels) tumor cells. NK cells cultured in the absence (Ctrl) or presence of normoxic (MV normoxia) or hypoxic (MV hypoxic) microvesicles (MVs), untreated or pre-incubated with anti-TGF-β1 blocking antibody (+TGF-β1) or its corresponding isotype (+Isotype). Untreated or MV-treated NK cells were co-cultured with IGR-Heu or K562 tumor cells and the percentage of tumor cell lysis was assessed as described in Fig. 2A. A statistically significant differences (indicated by asterisks) in NK-mediated lysis between hypoxic tumor cells treated with isotype or TGF-β1 blocking antibody are shown (*, p < 0.05; **, p < 0.005; ***, p < 0.0005; ns, not significant). (B) Effect of blocking TGF-β on the expression of IFNγ by NK cells. The expression of intracytoplasmic IFNγ in NK-92 (upper panel) or NKD (lower panel) cells, cultured in the absence (Ctrl) or presence of normoxic (N) or hypoxic (H) MVs, untreated (−) or pre-treated (+) with anti-TGF-β1 blocking antibody or its corresponding isotype. Data are reported as a percentage of positive cells of three independent experiments with standard deviation. Statistically significant differences (indicated by asterisks) in the percentage of IFNγ positive cells are shown (*, p < 0.05; **, p < 0.005). (C) Effect of blocking TGF-β1 on the secretion of IFNγ by NK cells. The quantification of IFNγ was performed by ELISA on NK-92 (upper panel) or NKD (lower panel) cells described in B. Data are reported as pg IFNγ/mL. Statistically significant differences (indicated by asterisks) in the amount of IFNγ are shown (*,p < 0.05; **, p < 0.005).

Figure 5. Profiling of microRNA in microvesicles (MVs) derived from hypoxic and normoxic IGR-Heu cells. (A) Bio-analyzer of small nucleic acid content of normoxic (upper) or hypoxic (lower) MVs containing exosomes. (B) miRNA profiling of MVs containing exosomes derived from normoxic or hypoxic tumor cells using Taqman miRNA arrays. Data analysis revealed the presence of 20 upregulated and 44 downregulated miRNAs in hypoxic compared to normoxic MVs with a change greater than 2-fold. (C) Mapping of has-miR-23a on the mRNA 3′-UTR of LAMP1 (source TargetScan: http://www.targetscan.org). (D) Validation of the expression of miRNAs identified by Taqman miRNA array. Real time PCR analysis of miR-23a, miR-210, miR-23b, and let-27b expression in normoxic and hypoxic MVs derived from IGR-Heu, K562, and T1 tumor cells. Statistically significant differences (indicated by asterisks) in the expression of miR-23a and -210 are shown (*, p < 0.05; **, p < 0.005; *** p < 0.0005).
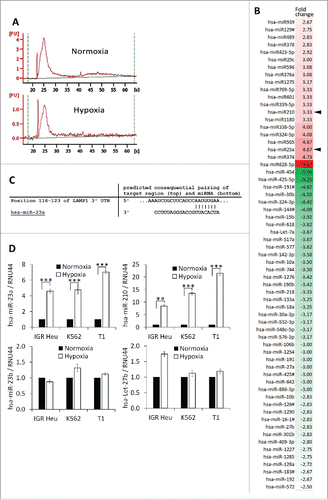
Figure 5. Profiling of microRNA in microvesicles (MVs) derived from hypoxic and normoxic IGR-Heu cells. (A) Bio-analyzer of small nucleic acid content of normoxic (upper) or hypoxic (lower) MVs containing exosomes. (B) miRNA profiling of MVs containing exosomes derived from normoxic or hypoxic tumor cells using Taqman miRNA arrays. Data analysis revealed the presence of 20 upregulated and 44 downregulated miRNAs in hypoxic compared to normoxic MVs with a change greater than 2-fold. (C) Mapping of has-miR-23a on the mRNA 3′-UTR of LAMP1 (source TargetScan: http://www.targetscan.org). (D) Validation of the expression of miRNAs identified by Taqman miRNA array. Real time PCR analysis of miR-23a, miR-210, miR-23b, and let-27b expression in normoxic and hypoxic MVs derived from IGR-Heu, K562, and T1 tumor cells. Statistically significant differences (indicated by asterisks) in the expression of miR-23a and -210 are shown (*, p < 0.05; **, p < 0.005; *** p < 0.0005).

Figure 6. Effect of miR-23a on the cytotoxicity of natural killer (NK) cells. (A) Effect of pre-miR-23a transfection on the expression of miR-210 in NK cells. NK-92 cells were untransfected (UT) or transfected with pre-miR control (pre-miR-Ctrl) or different concentrations of pre-miR-23a. Cells were subjected to real time PCR analysis for the expression of miR-23a (upper panel); miR-210 (middle panel) and miR-27a (lower panel) used as control. (B) Cytotoxicity of NK-92 cells expressing pre-miR-23a. NK-92 cells, transfected as described in A, were co-cultured with IGR-Heu (upper panel); K562 (middle panel), or T1 (lower panel) cells and the percentage of tumor cell lysis was assessed at different effector: target ratios (30:1, 10:1 or 3:1) as described in . Statistically significant differences (indicated by asterisks) in the cytotoxicity of NK cells expressing pre-miR-Ctrl and pre-miR-23a are shown (*, p < 0.05; **, p < 0.005). (C) Real time PCR analysis of LAMP1, IFNγ, GzmB, and PFN mRNA expression in NK-92 cells untransfected (UT) or transfected with either pre-miR control (Ctrl) or pre-miR-23a.Statistically significant differences (indicated by asterisks) in the expression of LAMP1, IFNγ, GzmB, and PFN in NK cells expressing pre-miR-Ctrl and pre-miR-23a are shown (*, p < 0.05; **, p < 0.005; ***, p < 0.0005; ns, not significant). (D) The expression of CD107a, IFNγ, and GzmB in NK-92 cells transfected pre-miR-Ctrl or pre-miR-23a and cultured alone or in the presence of K562 target cells. Statistically significant differences (indicated by asterisks) are shown (**, p < 0.005; ns, not significant). (E) Luciferase reporter gene assay performed using NK-92 cells co-transfected with either pre-miR control (Ctrl) and control vector or pre-miR-23a and vector encoding3′-UTR of LAMP1. After48 h, firefly and renilla luciferase activities were measured using the Dual-Luciferase Reporter assay and the ratio of firefly/renilla luciferase was determined. Statistically significant differences (indicated by asterisks) are shown. The experiment was performed in triplicate and repeated two times with the same results. Error bars indicate standard deviation. Statistically significant differences (indicated by asterisks) are shown (**, p < 0.005).
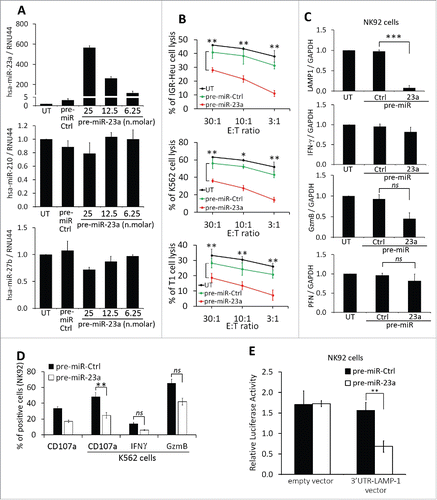
Figure 6. Effect of miR-23a on the cytotoxicity of natural killer (NK) cells. (A) Effect of pre-miR-23a transfection on the expression of miR-210 in NK cells. NK-92 cells were untransfected (UT) or transfected with pre-miR control (pre-miR-Ctrl) or different concentrations of pre-miR-23a. Cells were subjected to real time PCR analysis for the expression of miR-23a (upper panel); miR-210 (middle panel) and miR-27a (lower panel) used as control. (B) Cytotoxicity of NK-92 cells expressing pre-miR-23a. NK-92 cells, transfected as described in A, were co-cultured with IGR-Heu (upper panel); K562 (middle panel), or T1 (lower panel) cells and the percentage of tumor cell lysis was assessed at different effector: target ratios (30:1, 10:1 or 3:1) as described in Fig. 2A. Statistically significant differences (indicated by asterisks) in the cytotoxicity of NK cells expressing pre-miR-Ctrl and pre-miR-23a are shown (*, p < 0.05; **, p < 0.005). (C) Real time PCR analysis of LAMP1, IFNγ, GzmB, and PFN mRNA expression in NK-92 cells untransfected (UT) or transfected with either pre-miR control (Ctrl) or pre-miR-23a.Statistically significant differences (indicated by asterisks) in the expression of LAMP1, IFNγ, GzmB, and PFN in NK cells expressing pre-miR-Ctrl and pre-miR-23a are shown (*, p < 0.05; **, p < 0.005; ***, p < 0.0005; ns, not significant). (D) The expression of CD107a, IFNγ, and GzmB in NK-92 cells transfected pre-miR-Ctrl or pre-miR-23a and cultured alone or in the presence of K562 target cells. Statistically significant differences (indicated by asterisks) are shown (**, p < 0.005; ns, not significant). (E) Luciferase reporter gene assay performed using NK-92 cells co-transfected with either pre-miR control (Ctrl) and control vector or pre-miR-23a and vector encoding3′-UTR of LAMP1. After48 h, firefly and renilla luciferase activities were measured using the Dual-Luciferase Reporter assay and the ratio of firefly/renilla luciferase was determined. Statistically significant differences (indicated by asterisks) are shown. The experiment was performed in triplicate and repeated two times with the same results. Error bars indicate standard deviation. Statistically significant differences (indicated by asterisks) are shown (**, p < 0.005).

Figure 7. Targeting miR-23a in hypoxic TD-MVs restores the cytotoxicity of natural killer (NK) cells co-cultured with hypoxic TD-MVs. Real time PCR analysis of the expression of miR-23a. Normoxic (N) or hypoxic MVs derived from IGR-Heu, K562, and T1 tumor cells were untransfected (−) or transfected (+) with anti-miR control (anti-miR-Ctrl) or anti-miR-23a. Results are reported as a ratio between miR-23a and RNU44 (used as housekeeping gene). Statistically significant differences (indicated by asterisks) in the expression of miR-23a are shown (**, p < 0.005; ***, p < 0.0005). (B) Schematic representation of the experimental design used to analyze the effect of targeting miR-23a expression in hypoxic MVs on the cytotoxicity of NK cells. Normoxic and hypoxic MVs were isolated from indicated the tumor cells cultured under normoxic or hypoxic conditions. Untransfected normoxic MVs and hypoxic MVs transfected with anti-miR-23a were incubated with NK-92 cells. Following co-culture with tumor cells, NK cells were sorted and their function evaluated in term of cytotoxicity and the expression of CD107a, IFN-g, GzmB, and perforin. (C) Real time PCR analysis of the mRNA expression of CD107a(LAMP1), IFNγ, Granzyme B (GzmB), and perforin (PFN)in NK-92 cells treated with normoxic or hypoxic MVs, untransfected or transfected with either anti-miR control (+anti-miR-Ctrl) or anti-miR-23a (+anti-miR-23a) derived from IGR-Heu (upper), K562 (middle) or T1 (lower) tumor cells as described in B. Statistically significant differences (indicated by asterisks) in the expression of LAMP1, IFNγ, GzmB, and PFN are shown (*, p < 0.05; **, p < 0.005; ***, p < 0.0005; ns, not significant). (D) Intra-cytoplasmic staining of CD107a (upper) and IFN-g (lower) in control (Ctrl)NK-92cells or in cells untreated (−) or treated (+) with normoxic (N) or hypoxic (H) MV derived from indicated tumor cell lines as described in B. Statistically significant differences (indicated by asterisks) in the percentage of CD107a and IFNγ positive cells are shown (*, p < 0.05; **, p < 0.005; ns, not significant).
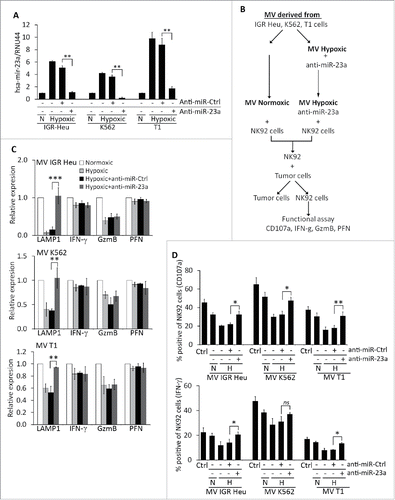
Figure 7. Targeting miR-23a in hypoxic TD-MVs restores the cytotoxicity of natural killer (NK) cells co-cultured with hypoxic TD-MVs. Real time PCR analysis of the expression of miR-23a. Normoxic (N) or hypoxic MVs derived from IGR-Heu, K562, and T1 tumor cells were untransfected (−) or transfected (+) with anti-miR control (anti-miR-Ctrl) or anti-miR-23a. Results are reported as a ratio between miR-23a and RNU44 (used as housekeeping gene). Statistically significant differences (indicated by asterisks) in the expression of miR-23a are shown (**, p < 0.005; ***, p < 0.0005). (B) Schematic representation of the experimental design used to analyze the effect of targeting miR-23a expression in hypoxic MVs on the cytotoxicity of NK cells. Normoxic and hypoxic MVs were isolated from indicated the tumor cells cultured under normoxic or hypoxic conditions. Untransfected normoxic MVs and hypoxic MVs transfected with anti-miR-23a were incubated with NK-92 cells. Following co-culture with tumor cells, NK cells were sorted and their function evaluated in term of cytotoxicity and the expression of CD107a, IFN-g, GzmB, and perforin. (C) Real time PCR analysis of the mRNA expression of CD107a(LAMP1), IFNγ, Granzyme B (GzmB), and perforin (PFN)in NK-92 cells treated with normoxic or hypoxic MVs, untransfected or transfected with either anti-miR control (+anti-miR-Ctrl) or anti-miR-23a (+anti-miR-23a) derived from IGR-Heu (upper), K562 (middle) or T1 (lower) tumor cells as described in B. Statistically significant differences (indicated by asterisks) in the expression of LAMP1, IFNγ, GzmB, and PFN are shown (*, p < 0.05; **, p < 0.005; ***, p < 0.0005; ns, not significant). (D) Intra-cytoplasmic staining of CD107a (upper) and IFN-g (lower) in control (Ctrl)NK-92cells or in cells untreated (−) or treated (+) with normoxic (N) or hypoxic (H) MV derived from indicated tumor cell lines as described in B. Statistically significant differences (indicated by asterisks) in the percentage of CD107a and IFNγ positive cells are shown (*, p < 0.05; **, p < 0.005; ns, not significant).

Figure 8. The effect of tumor derived microvesicles (MVs) on the function of natural killer (NK) cells in vivo. Mice were injected intradermally every day for 7 d with phosphate buffered saline (PBS) or with 50 μg of normoxic (N) or hypoxic (H) MVs in PBS derived from IGR Heu or K562 tumor cells. NK cells were sorted from draining lymph nodes by cd49b antibody coated beads and co-cultured with Renca cells. After separation from their target, the expression of CD107a (upper), IFNγ (Middle), and GzmB (lower) was assessed by FACS analysis.
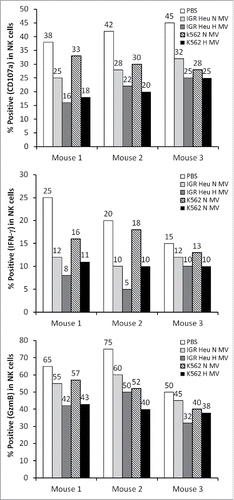
Figure 8. The effect of tumor derived microvesicles (MVs) on the function of natural killer (NK) cells in vivo. Mice were injected intradermally every day for 7 d with phosphate buffered saline (PBS) or with 50 μg of normoxic (N) or hypoxic (H) MVs in PBS derived from IGR Heu or K562 tumor cells. NK cells were sorted from draining lymph nodes by cd49b antibody coated beads and co-cultured with Renca cells. After separation from their target, the expression of CD107a (upper), IFNγ (Middle), and GzmB (lower) was assessed by FACS analysis.