3,157
Views
57
CrossRef citations to date
0
Altmetric
Original Research

Co-delivery of PLGA encapsulated invariant NKT cell agonist with antigenic protein induce strong T cell-mediated antitumor immune responses

, , , , , , , & show all
Article: e1068493 | Received 12 Mar 2015, Accepted 27 Jun 2015, Published online: 08 Jan 2016

Figures & data

Figure 1. In vivo antigen-specific T cell responses induced by nanoparticles. (A) Mice were vaccinated with indicated nanoparticle combinations and transferred with SIINFEKL peptide-loaded syngeneic target cells and irrelevant peptide-loaded control cells. Primary antigen-specific in vivo killing responses (left) and SIINFEKL H-2Kb tetramer-positive cell percentages (right) obtained by OVA and α-GalCer or TLR-L injections were demonstrated. Results of three independent experiments were pooled. n> 6 for each group (B) OT-I T-cell proliferation induced by nanoparticle administration to wild type naive mice, n=5 (left). Comparison of OVA+ α-GalCer nanoparticle induced proliferation of OT-I T cells transferred to either CD1d KO or wild-type mice, n=30 (right). Parenthesis indicates encapsulation, ↔ indicates injection of NP(OVA) and free α-GalCer to different veins consequently. 0,66ug OVA, 1ng α-GalCer, 143ng R848 and 70ng poly I:C was introduced within NPs. Mean values were shown with standard error, ns: no significance, * p < .05, ** p < .01, *** p < .001
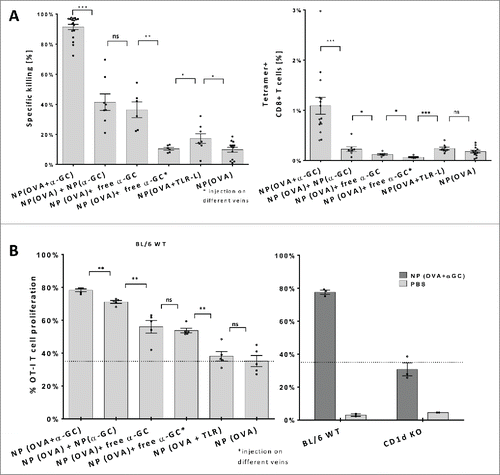
Figure 1. In vivo antigen-specific T cell responses induced by nanoparticles. (A) Mice were vaccinated with indicated nanoparticle combinations and transferred with SIINFEKL peptide-loaded syngeneic target cells and irrelevant peptide-loaded control cells. Primary antigen-specific in vivo killing responses (left) and SIINFEKL H-2Kb tetramer-positive cell percentages (right) obtained by OVA and α-GalCer or TLR-L injections were demonstrated. Results of three independent experiments were pooled. n> 6 for each group (B) OT-I T-cell proliferation induced by nanoparticle administration to wild type naive mice, n=5 (left). Comparison of OVA+ α-GalCer nanoparticle induced proliferation of OT-I T cells transferred to either CD1d KO or wild-type mice, n=30 (right). Parenthesis indicates encapsulation, ↔ indicates injection of NP(OVA) and free α-GalCer to different veins consequently. 0,66ug OVA, 1ng α-GalCer, 143ng R848 and 70ng poly I:C was introduced within NPs. Mean values were shown with standard error, ns: no significance, * p < .05, ** p < .01, *** p < .001

Figure 2. Cytokine responses obtained by nanoparticle encapsulated α-GalCer and TLR-ligands. (A) IFN-g levels of 48h splenocyte cultures with indicated NPs or free α-GalCer in solution. (B) IL-6 levels of 48h splenocyte cultures with indicated NPs. Splenocytes were isolated from either naive wild-type BL/6 or CD1d KO BL/6 mice (A-B, n>4). (C) IFN-g serum levels measured 24 h after iv. injections of 1ng α-GalCer either in nanoparticles or free. Vaccinations were repeated 2 times on days 7 and 14, empty particles were used as a control, n≥3. Mean values were shown with standard error. (D) IL-2 response curves of DN32D3 NKT cell hybridoma cultured 24h with α-GalCer loaded BMDCs. α-GalCer was serially diluted in DMSO, RMPI medium or PBS 0.05% tween 20 (Vehicle) and cultured with BMDCs at a range of 25ng-0.01ng/mL. One representative graph of three experiments was shown.
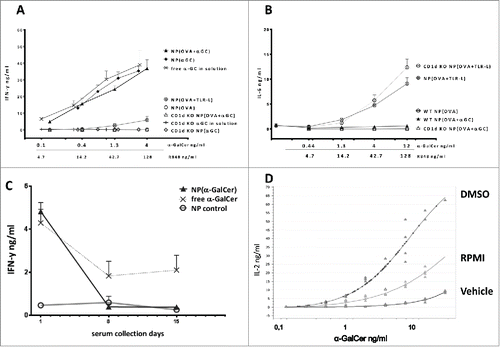
Figure 2. Cytokine responses obtained by nanoparticle encapsulated α-GalCer and TLR-ligands. (A) IFN-g levels of 48h splenocyte cultures with indicated NPs or free α-GalCer in solution. (B) IL-6 levels of 48h splenocyte cultures with indicated NPs. Splenocytes were isolated from either naive wild-type BL/6 or CD1d KO BL/6 mice (A-B, n>4). (C) IFN-g serum levels measured 24 h after iv. injections of 1ng α-GalCer either in nanoparticles or free. Vaccinations were repeated 2 times on days 7 and 14, empty particles were used as a control, n≥3. Mean values were shown with standard error. (D) IL-2 response curves of DN32D3 NKT cell hybridoma cultured 24h with α-GalCer loaded BMDCs. α-GalCer was serially diluted in DMSO, RMPI medium or PBS 0.05% tween 20 (Vehicle) and cultured with BMDCs at a range of 25ng-0.01ng/mL. One representative graph of three experiments was shown.

Figure 3. Antitumor effects of (OVA+α-GalCer) nanoparticle immunization. (A) Mice were immunized on day 0 with indicated vaccines and B16.OVA cells were subcutaneously inoculated on day 7(dotted line). Survival results of two independent experiments were shown. Censored data points were shown with symbols. PBS, n= 7; NP(OVA+TLR-L), n=8 and NP(OVA+ α-GalCer), n=8. (B) Vaccinations were performed on day 0 and tumors were inoculated on day 7 as in A. NP(OVA+ α-GalCer) group was re-challenged with tumor cells on day 50 and 78 (dotted line). NP(OVA+TLR-L) n=6, NP(OVA+ α-GalCer) n=8 . (C) Mice were first subcutaneously inoculated with B16.OVA cells and vaccinations were started individually when each tumor reached ≈30mm3 and repeated three times weekly. NP(OVA), n=7, Mitv=26mm3; NP(OVA+TLR-L), n=13, Mitv=33mm3 ; NP(OVA+α-GalCer), n=19, Mitv=33mm3. Data points of mice culled due to early necrosis were censored. Censored data points were shown with symbols. Mitv: Mean initial tumor volume. *** P < .001.(D) Serum samples were collected 24 h after each vaccination of tumor-bearing mice in (C) and IFN-g levels were determined by ELISA. n=7. Mean results were shown with standard error.
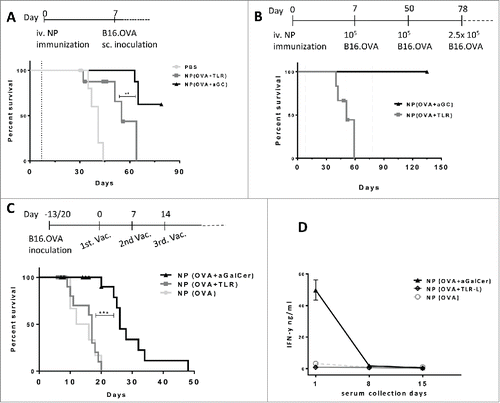
Figure 3. Antitumor effects of (OVA+α-GalCer) nanoparticle immunization. (A) Mice were immunized on day 0 with indicated vaccines and B16.OVA cells were subcutaneously inoculated on day 7(dotted line). Survival results of two independent experiments were shown. Censored data points were shown with symbols. PBS, n= 7; NP(OVA+TLR-L), n=8 and NP(OVA+ α-GalCer), n=8. (B) Vaccinations were performed on day 0 and tumors were inoculated on day 7 as in A. NP(OVA+ α-GalCer) group was re-challenged with tumor cells on day 50 and 78 (dotted line). NP(OVA+TLR-L) n=6, NP(OVA+ α-GalCer) n=8 . (C) Mice were first subcutaneously inoculated with B16.OVA cells and vaccinations were started individually when each tumor reached ≈30mm3 and repeated three times weekly. NP(OVA), n=7, Mitv=26mm3; NP(OVA+TLR-L), n=13, Mitv=33mm3 ; NP(OVA+α-GalCer), n=19, Mitv=33mm3. Data points of mice culled due to early necrosis were censored. Censored data points were shown with symbols. Mitv: Mean initial tumor volume. *** P < .001.(D) Serum samples were collected 24 h after each vaccination of tumor-bearing mice in (C) and IFN-g levels were determined by ELISA. n=7. Mean results were shown with standard error.

Figure 4. Intratumoral T cell infiltration after therapeutic vaccinations. Similar sized tumors were isolated 8 d after first vaccination. Frozen tumor tissues were screened for CTL infiltration by CD8+ (red) and DAPI (Blue) staining by Vectra automated quantitative imaging system. NP(OVA), n=2; NP(OVA+TLR-L), n=4; NP(OVA+α-GalCer), n=2.
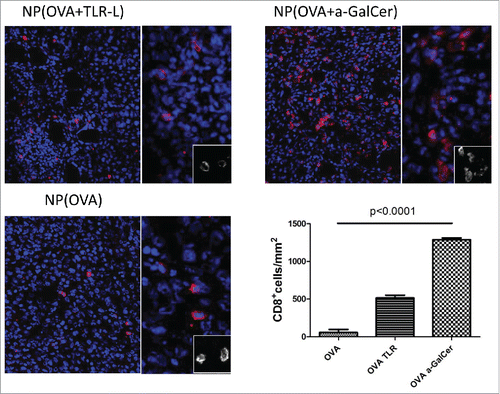
Figure 4. Intratumoral T cell infiltration after therapeutic vaccinations. Similar sized tumors were isolated 8 d after first vaccination. Frozen tumor tissues were screened for CTL infiltration by CD8+ (red) and DAPI (Blue) staining by Vectra automated quantitative imaging system. NP(OVA), n=2; NP(OVA+TLR-L), n=4; NP(OVA+α-GalCer), n=2.
Supplemental material

1068493_Supplemental_Files.zip

Download Zip (1.5 MB)