1,080
Views
10
CrossRef citations to date
0
Altmetric
Original Research

Formylpeptide receptor 1 mediates the tumorigenicity of human hepatocellular carcinoma cells

, , , , , , , , , , , , & show all
Article: e1078055 | Received 20 Jan 2015, Accepted 22 Jul 2015, Published online: 26 Feb 2016

Figures & data

Figure 1. FPR1 expression in human hepatocellular carcinoma tissues. Sections of 20 samples from grade III (A) and II (B) hepatocellular carcinoma and 10 samples of adjacent normal liver tissues (C) were stained with an antibody against FPR1 (green) and counterstained with DAPI (blue). Representative intratumor (upper panels) and peritumor (lower panels) immunofluorescence staining (left panels) and corresponding H&E staining (right panels) are shown. Bar = 100 μm. (D), quantitative PCR analysis showing the level of FPR1 gene in intratumor or peritumor tissues of grade III and II hepatocellular carcinoma and adjacent normal liver tissues. The data was shown as the mean-fold changes of FPR1 expression levels (± SEM) after intra-sample normalization to the levels of GAPDH. * p <0.05, statistically significant difference vs. adjacent normal liver tissues in values.
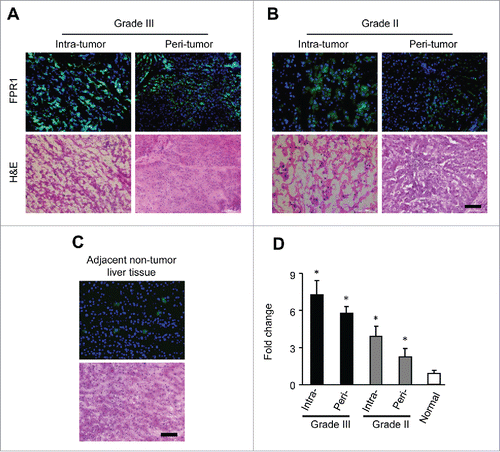
Figure 1. FPR1 expression in human hepatocellular carcinoma tissues. Sections of 20 samples from grade III (A) and II (B) hepatocellular carcinoma and 10 samples of adjacent normal liver tissues (C) were stained with an antibody against FPR1 (green) and counterstained with DAPI (blue). Representative intratumor (upper panels) and peritumor (lower panels) immunofluorescence staining (left panels) and corresponding H&E staining (right panels) are shown. Bar = 100 μm. (D), quantitative PCR analysis showing the level of FPR1 gene in intratumor or peritumor tissues of grade III and II hepatocellular carcinoma and adjacent normal liver tissues. The data was shown as the mean-fold changes of FPR1 expression levels (± SEM) after intra-sample normalization to the levels of GAPDH. * p <0.05, statistically significant difference vs. adjacent normal liver tissues in values.

Figure 2. The expression of FPR1 protein and mRNA in human hepatoma cell lines. (A) FACS analysis of FPR1 expression on hepatic cancer cells lines HepG2 and Hep3B. Human monocytes were used as controls. The results are from representative of three independent experiments. (B) the expression of FPR1 mRNA in hepatoma cell lines. Representative quantitative PCR results from three independent experiments are shown as the mean-fold changes of FPR1 expression levels (± SEM) after intra-sample normalization to the levels of GAPDH.
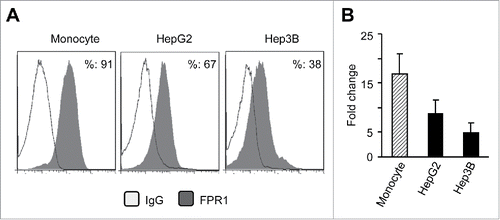
Figure 2. The expression of FPR1 protein and mRNA in human hepatoma cell lines. (A) FACS analysis of FPR1 expression on hepatic cancer cells lines HepG2 and Hep3B. Human monocytes were used as controls. The results are from representative of three independent experiments. (B) the expression of FPR1 mRNA in hepatoma cell lines. Representative quantitative PCR results from three independent experiments are shown as the mean-fold changes of FPR1 expression levels (± SEM) after intra-sample normalization to the levels of GAPDH.

Figure 3. Responsiveness of human hepatoma cell lines to fMLF. (A) chemotaxis of HepG2 (upper panels) and Hep3B (lower panels) cells in response to 100 nM fMLF. (B) inhibition of HepG2 cell migration in response to 100 nM fMLF by pretreatment of the cells with PT (100 ng/mL) or the FPR1-specific antagonist tBoc-MLF (1 µM) for 30 min at 37°C. Representative results from three independent experiments are shown. (C) percentage of HepG2 cell migration in response to different concentrations of fMLF (in the presence or absence of PT or tBoc-MLF) over total loading cells. (D) and (E), motility in wound-healing model. HepG2 cells grown to confluence on plastic were scratched to create a wound. p < 0.05, vehicle-treated vs. fMLF-treated cells. (D) cells in 10 % FCS/DMEM were photographed at 0 and 8 h. The results are representative of three independent experiments. (E) the mean distance (mm) of leading cells moving toward the ‘wound’ area was assessed. *Indicates significantly slower locomotion of HepG2 cells treated with vehicle (n = 3) * p < 0.05, vehicle-treated vs. fMLF-treated cells.
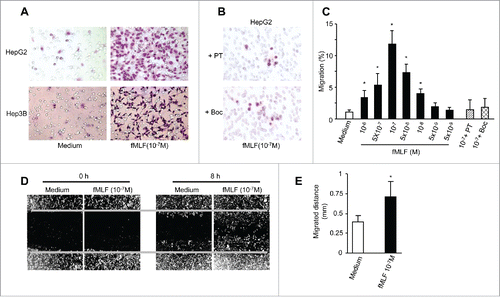
Figure 3. Responsiveness of human hepatoma cell lines to fMLF. (A) chemotaxis of HepG2 (upper panels) and Hep3B (lower panels) cells in response to 100 nM fMLF. (B) inhibition of HepG2 cell migration in response to 100 nM fMLF by pretreatment of the cells with PT (100 ng/mL) or the FPR1-specific antagonist tBoc-MLF (1 µM) for 30 min at 37°C. Representative results from three independent experiments are shown. (C) percentage of HepG2 cell migration in response to different concentrations of fMLF (in the presence or absence of PT or tBoc-MLF) over total loading cells. (D) and (E), motility in wound-healing model. HepG2 cells grown to confluence on plastic were scratched to create a wound. p < 0.05, vehicle-treated vs. fMLF-treated cells. (D) cells in 10 % FCS/DMEM were photographed at 0 and 8 h. The results are representative of three independent experiments. (E) the mean distance (mm) of leading cells moving toward the ‘wound’ area was assessed. *Indicates significantly slower locomotion of HepG2 cells treated with vehicle (n = 3) * p < 0.05, vehicle-treated vs. fMLF-treated cells.

Figure 4. Calcium (Ca2+) mobilization in human hepatoma cells induced by fMLF. Ca2+ mobilization in HepG2 cells was measured with a FlexStation II384 system using Fura-3 AM. Changes in intracellular calcium concentration in response to agonists were recorded as relative fluorescence units (RFUs). (A) dose response of fMLF-induced Ca2+ flux in HepG2 cells. (B) inhibition of HepG2 cell response to 10 nM fMLF by pretreatment of the cells with PT (100 ng/mL) but not CT (100 ng/mL). (C) and (D), cross-desensitization of Ca2+ flux in human hepatoma cells. (C), desensitization of 10 nM fMLF induced Ca2+ flux by 1 μM fMLF in HepG2 cells. (D), 1 μM fMLF-treated HepG2 cell response to second challenge by 10 nM fMLF. Representative results from three independent experiments are shown.
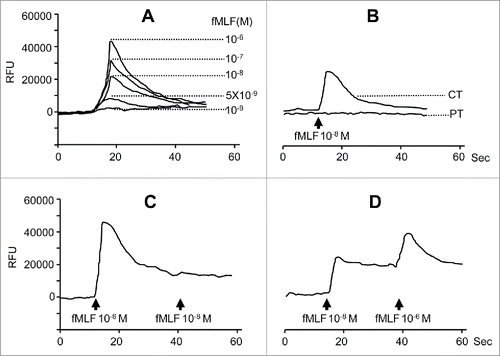
Figure 4. Calcium (Ca2+) mobilization in human hepatoma cells induced by fMLF. Ca2+ mobilization in HepG2 cells was measured with a FlexStation II384 system using Fura-3 AM. Changes in intracellular calcium concentration in response to agonists were recorded as relative fluorescence units (RFUs). (A) dose response of fMLF-induced Ca2+ flux in HepG2 cells. (B) inhibition of HepG2 cell response to 10 nM fMLF by pretreatment of the cells with PT (100 ng/mL) but not CT (100 ng/mL). (C) and (D), cross-desensitization of Ca2+ flux in human hepatoma cells. (C), desensitization of 10 nM fMLF induced Ca2+ flux by 1 μM fMLF in HepG2 cells. (D), 1 μM fMLF-treated HepG2 cell response to second challenge by 10 nM fMLF. Representative results from three independent experiments are shown.

Figure 5. FPR1-mediated ERK1/2 activation and IL-8 production by HepG2 hepatoma cells. (A), lysates of HepG2 cells stimulated with 100 nM fMLF for 15 min were examined for phosphorylated ERK1/2 by Western blotting. Total ERK1/2 expression was used as a control. (B) production of IL-8 by fMLF-stimulated hepatoma cells. Levels of IL-8 protein in the supernatants of HepG2 cells treated with different concentrations of fMLF were measured by ELISA. HepG2 cells were also pre-incubated with the MEK1 inhibitor PD98059 (PD) at 50 μ M for 60 min then treated with 100 nM fMLF at 37°C to collect culture medium at 24 and 48 h. The experiments were repeated three times and each time point consisted of three replicate samples. The results are presented as the mean ± SEM. p < 0.05, vehicle-treated vs. fMLF-treated cells. (C), formation of capillary-like structures on Matrigel by HepG2 cells. Culture supernatants from HepG2 cells treated with 100 nM fMLF for 72 h were incubated with an anti-IL-8 antibody (+) or IgG (-) (each at 1 μg/mL) for 45 min. HUVECs were then mixed with the supernatants and examined for tubule formation on Matrigel after 20 h. Photomicrographs were taken with a phase-contrast microscope. Representative results from 3 independent experiments are shown. (D) branching points and total length of tubule structure were quantified. Untreated or fMLF-treated HepG2 cells were pre-incubated in the presence or absence of a neutralizing anti-IL-8 antibody. The differences were examined for statistical significance with Student's t test (n = 5). Values represent the mean ± SEM. p < 0.05, vehicle-treated vs. fMLF-treated cells.
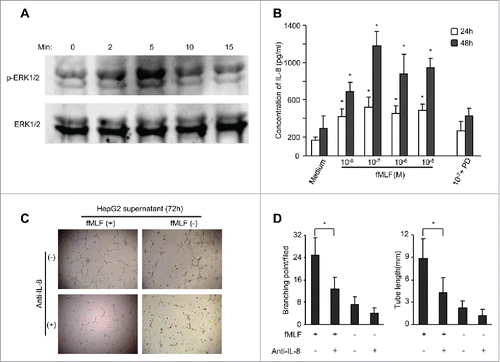
Figure 5. FPR1-mediated ERK1/2 activation and IL-8 production by HepG2 hepatoma cells. (A), lysates of HepG2 cells stimulated with 100 nM fMLF for 15 min were examined for phosphorylated ERK1/2 by Western blotting. Total ERK1/2 expression was used as a control. (B) production of IL-8 by fMLF-stimulated hepatoma cells. Levels of IL-8 protein in the supernatants of HepG2 cells treated with different concentrations of fMLF were measured by ELISA. HepG2 cells were also pre-incubated with the MEK1 inhibitor PD98059 (PD) at 50 μ M for 60 min then treated with 100 nM fMLF at 37°C to collect culture medium at 24 and 48 h. The experiments were repeated three times and each time point consisted of three replicate samples. The results are presented as the mean ± SEM. p < 0.05, vehicle-treated vs. fMLF-treated cells. (C), formation of capillary-like structures on Matrigel by HepG2 cells. Culture supernatants from HepG2 cells treated with 100 nM fMLF for 72 h were incubated with an anti-IL-8 antibody (+) or IgG (-) (each at 1 μg/mL) for 45 min. HUVECs were then mixed with the supernatants and examined for tubule formation on Matrigel after 20 h. Photomicrographs were taken with a phase-contrast microscope. Representative results from 3 independent experiments are shown. (D) branching points and total length of tubule structure were quantified. Untreated or fMLF-treated HepG2 cells were pre-incubated in the presence or absence of a neutralizing anti-IL-8 antibody. The differences were examined for statistical significance with Student's t test (n = 5). Values represent the mean ± SEM. p < 0.05, vehicle-treated vs. fMLF-treated cells.

Figure 6. The effect of FPR1 shRNA on tumorigenicity of HepG2 cells in athymic mice. (A) the expression of FPR1 mRNA. The levels of FPR1 mRNA were examined by RT-PCR in HepG2 cells stably transfected with FPR1 shRNA. Wild-type (WT, nontransfected) and mock-transfected HepG2 cells were used as control. GAPDH PCR product was used as a loading control. Representative results from three independent experiments are shown. (B) migration of FPR1 shRNA-transfected HepG2 cells in response to fMLF. Percentage of FPR1-mediated cell migration in total loaded cells was calculated. Values represent the mean ± SEM (n = 3). * p < 0.05, compared with mock-transfected cells. (C) the effect of FPR1 shRNA on IL-8 production by HepG2 cells. IL-8 in the supernatants of HepG2 cells cultured in the presence of fMLF was measured by ELISA after 24 and 48 h. The experiments were repeated three times, and each time point consisted of three replicate samples. Values represent the mean ± SEM. * p < 0.05, mock-transfected vs. shRNA-transfected cells. (D) growth curves of mock- and shRNA-transfected HepG2 cells in response to 100 nM fMLF. Cell growth was measured by MTT assays and the results were expressed as the mean ± SEM OD values. Asterisk indicates significantly increased proliferation of HepG2 cells stimulated by fMLF, as compared to non-stimulated cells (p < 0.05). (E) tumor formation. HepG2 cells (at 1 × 10⁶ cells in 100 μL of PBS per mouse) were injected subcutaneously into the flanks of athymic mice (10 mice per group). Mice were examined for tumor formation at indicated times. (F) representative images of xenograft tumors of each group at 45 d after HepG2 cell injection. * p < 0.05, tumors formed by mock- vs. FPR shRNA-transfected cells. (G) tumor growth. Tumor size 35 and 45 d after implantation of HepG2 cells is presented as the mean volume (mm3) of tumors from 10 mice per group. Values represent the mean ± SEM. * p < 0.05, compared with the tumors formed by mock-transfected cells. (H) survival rate of tumor-bearing mice was shown by Kaplan–Meier survival curves. * p < 0.05, mock- vs. FPR shRNA-transfected cells.
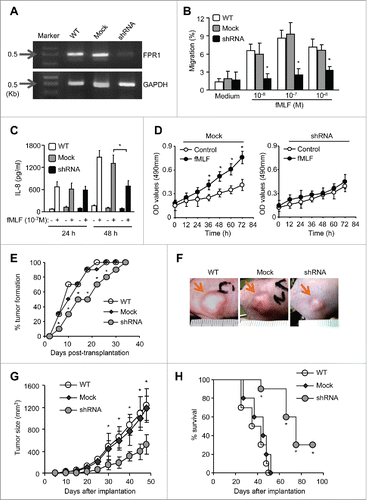
Figure 6. The effect of FPR1 shRNA on tumorigenicity of HepG2 cells in athymic mice. (A) the expression of FPR1 mRNA. The levels of FPR1 mRNA were examined by RT-PCR in HepG2 cells stably transfected with FPR1 shRNA. Wild-type (WT, nontransfected) and mock-transfected HepG2 cells were used as control. GAPDH PCR product was used as a loading control. Representative results from three independent experiments are shown. (B) migration of FPR1 shRNA-transfected HepG2 cells in response to fMLF. Percentage of FPR1-mediated cell migration in total loaded cells was calculated. Values represent the mean ± SEM (n = 3). * p < 0.05, compared with mock-transfected cells. (C) the effect of FPR1 shRNA on IL-8 production by HepG2 cells. IL-8 in the supernatants of HepG2 cells cultured in the presence of fMLF was measured by ELISA after 24 and 48 h. The experiments were repeated three times, and each time point consisted of three replicate samples. Values represent the mean ± SEM. * p < 0.05, mock-transfected vs. shRNA-transfected cells. (D) growth curves of mock- and shRNA-transfected HepG2 cells in response to 100 nM fMLF. Cell growth was measured by MTT assays and the results were expressed as the mean ± SEM OD values. Asterisk indicates significantly increased proliferation of HepG2 cells stimulated by fMLF, as compared to non-stimulated cells (p < 0.05). (E) tumor formation. HepG2 cells (at 1 × 10⁶ cells in 100 μL of PBS per mouse) were injected subcutaneously into the flanks of athymic mice (10 mice per group). Mice were examined for tumor formation at indicated times. (F) representative images of xenograft tumors of each group at 45 d after HepG2 cell injection. * p < 0.05, tumors formed by mock- vs. FPR shRNA-transfected cells. (G) tumor growth. Tumor size 35 and 45 d after implantation of HepG2 cells is presented as the mean volume (mm3) of tumors from 10 mice per group. Values represent the mean ± SEM. * p < 0.05, compared with the tumors formed by mock-transfected cells. (H) survival rate of tumor-bearing mice was shown by Kaplan–Meier survival curves. * p < 0.05, mock- vs. FPR shRNA-transfected cells.

Figure 7. FPR1 agonist activity in necrotic tumor supernatants. (A) chemotactic activity. Supernatants of HepG2 cells after three cycles of freezing and thawing (necrotic) were assayed for chemotactic activity on live HepG2 cells. Supernatants from apoptotic or live HepG2cells were used as controls. Percentage of cell migration in response to supernatants in total loaded cells was calculated. Data are expressed as the mean ± SEM (n = 3). * p < 0.05, compared with control medium. (B) chemotactic activity of supernatants of tumor tissue extracts. The supernatants from necrotic HepG2 tumor tissues were assessed for chemotactic activity on live HepG2 cells, which were pre-incubated in the presence or absence of the FPR1-specific antagonist tBoc-MLF at 37 °C for 30 min. Values represent the mean ± SEM (n = 3). * p < 0.05, compared with untreated (-) cells. (C), Ca2+ flux induced in HepG2 cells by necrotic tumor cell supernatants or fMLF. (D) desensitization of fMLF-induced Ca2+ flux by necrotic tumor cell supernatants in HepG2 cells. Representative results from three independent experiments are shown. (E) inhibition of FPR1 expression on ETFR cells by necrotic tumor cell supernatants. The level of FPR1 on the surface of ETFR cells, treated as indicated, was measured by flow cytometry with an anti-FPR1 antibody or normal IgG. Representative results from three independent experiments are shown as a percentage of FPR1-positive cells.
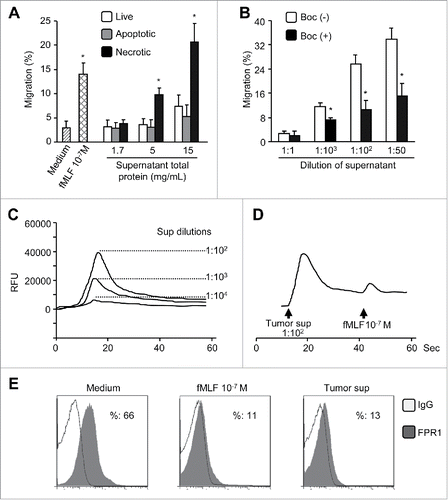
Figure 7. FPR1 agonist activity in necrotic tumor supernatants. (A) chemotactic activity. Supernatants of HepG2 cells after three cycles of freezing and thawing (necrotic) were assayed for chemotactic activity on live HepG2 cells. Supernatants from apoptotic or live HepG2cells were used as controls. Percentage of cell migration in response to supernatants in total loaded cells was calculated. Data are expressed as the mean ± SEM (n = 3). * p < 0.05, compared with control medium. (B) chemotactic activity of supernatants of tumor tissue extracts. The supernatants from necrotic HepG2 tumor tissues were assessed for chemotactic activity on live HepG2 cells, which were pre-incubated in the presence or absence of the FPR1-specific antagonist tBoc-MLF at 37 °C for 30 min. Values represent the mean ± SEM (n = 3). * p < 0.05, compared with untreated (-) cells. (C), Ca2+ flux induced in HepG2 cells by necrotic tumor cell supernatants or fMLF. (D) desensitization of fMLF-induced Ca2+ flux by necrotic tumor cell supernatants in HepG2 cells. Representative results from three independent experiments are shown. (E) inhibition of FPR1 expression on ETFR cells by necrotic tumor cell supernatants. The level of FPR1 on the surface of ETFR cells, treated as indicated, was measured by flow cytometry with an anti-FPR1 antibody or normal IgG. Representative results from three independent experiments are shown as a percentage of FPR1-positive cells.
Supplemental material

1078055_Supplementary_Material.docx

Download MS Word (1.3 MB)

Reprints and Corporate Permissions

Please note: Selecting permissions does not provide access to the full text of the article, please see our help page How do I view content?

To request a reprint or corporate permissions for this article, please click on the relevant link below:

Academic Permissions

Please note: Selecting permissions does not provide access to the full text of the article, please see our help page How do I view content?

Obtain permissions instantly via Rightslink by clicking on the button below:

If you are unable to obtain permissions via Rightslink, please complete and submit this Permissions form. For more information, please visit our Permissions help page.