2,639
Views
31
CrossRef citations to date
0
Altmetric
Original Research

Gene expression profiling of circulating tumor cells and peripheral blood mononuclear cells from breast cancer patients

, , , , , , , , , , & show all
Article: e1102827 | Received 08 Jun 2015, Accepted 26 Sep 2015, Published online: 08 Apr 2016

Figures & data

Figure 1. Principle component analysis and hierarchical clustering of relative gene expression in CTC-enriched samples. (A) Principal component analysis represents the differential gene expression pattern of CTC-enriched samples (black squares, n = 4) and healthy controls (white squares, n = 4). Axis: X = PC1: PCA Component 1 (71.98% variance); Y = PC2: PCA Component 2 (93.35% variance) Z = PC3: PCA Component 3 (96.94% variance). (B) Heat map depicting the expression levels of mRNAs in the CTC-enriched samples (CTC, n = 4) compared with their expression levels in healthy controls (n = 4). The red and green squares indicate high and low mRNA levels, respectively.
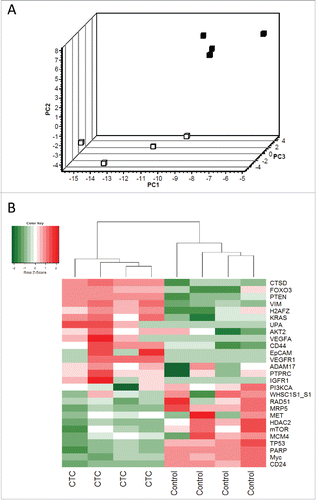
Figure 1. Principle component analysis and hierarchical clustering of relative gene expression in CTC-enriched samples. (A) Principal component analysis represents the differential gene expression pattern of CTC-enriched samples (black squares, n = 4) and healthy controls (white squares, n = 4). Axis: X = PC1: PCA Component 1 (71.98% variance); Y = PC2: PCA Component 2 (93.35% variance) Z = PC3: PCA Component 3 (96.94% variance). (B) Heat map depicting the expression levels of mRNAs in the CTC-enriched samples (CTC, n = 4) compared with their expression levels in healthy controls (n = 4). The red and green squares indicate high and low mRNA levels, respectively.

Figure 2. Gene expression profiling of selected genes in CTC-enriched samples. This figure shows the genes that were significantly differentially expressed. The PCR data were normalized to reference genes and expressed on a log2 scale. All values are presented as the mean ± SEM. White bars, healthy donors (n = 4); black bars, CTC-enriched samples (n = 4). The PCR data were analyzed by unpaired Student's t-test. Comparisons were considered significant at p ≤ 0.05.
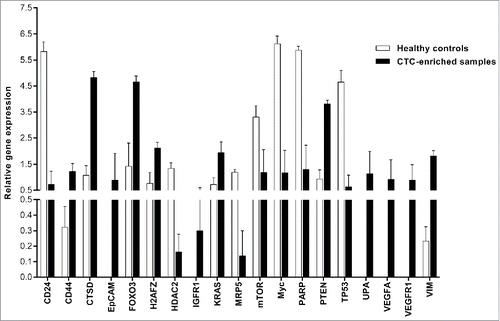
Figure 2. Gene expression profiling of selected genes in CTC-enriched samples. This figure shows the genes that were significantly differentially expressed. The PCR data were normalized to reference genes and expressed on a log2 scale. All values are presented as the mean ± SEM. White bars, healthy donors (n = 4); black bars, CTC-enriched samples (n = 4). The PCR data were analyzed by unpaired Student's t-test. Comparisons were considered significant at p ≤ 0.05.
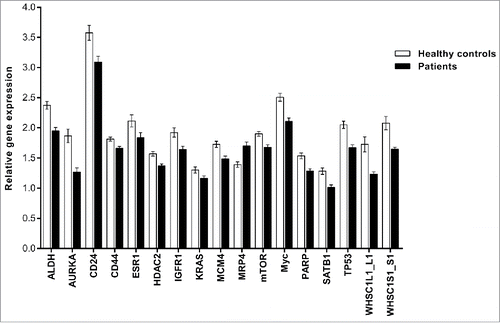
Figure 3. Gene expression profiling of significantly differentially expressed genes in PBMCs. This figure shows genes that were significantly differentially expressed in breast cancer patients only. The PCR data were normalized to the selected reference genes and expressed on a log2 scale. All values are presented as the mean ± SEM. White bars, control group (n = 43); black bars, breast cancer patients (n = 147). The PCR data were analyzed by unpaired Student's t-test. Comparisons were considered significant at p ≤ 0.05.

Figure 3. Gene expression profiling of significantly differentially expressed genes in PBMCs. This figure shows genes that were significantly differentially expressed in breast cancer patients only. The PCR data were normalized to the selected reference genes and expressed on a log2 scale. All values are presented as the mean ± SEM. White bars, control group (n = 43); black bars, breast cancer patients (n = 147). The PCR data were analyzed by unpaired Student's t-test. Comparisons were considered significant at p ≤ 0.05.

Figure 4. Correlation analyses of gene expression profiles and clinical parameters of patients. Each plot represents correlation of particular gene expression with formation of metastasis (A), tumor grade (B), and HER2/neu receptor status (C). We observed that downregulated expression of selected genes in the PBMCs of breast cancer patients (n = 147) is significantly associated (p ≤ 0.05, p-values are controlled for false positives) with formation of metastasis (A), tumor grade (B), and HER2/neu receptor status (C).
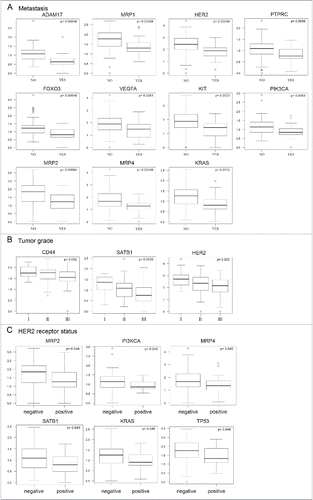
Figure 4. Correlation analyses of gene expression profiles and clinical parameters of patients. Each plot represents correlation of particular gene expression with formation of metastasis (A), tumor grade (B), and HER2/neu receptor status (C). We observed that downregulated expression of selected genes in the PBMCs of breast cancer patients (n = 147) is significantly associated (p ≤ 0.05, p-values are controlled for false positives) with formation of metastasis (A), tumor grade (B), and HER2/neu receptor status (C).

Figure 5. TCGA data analysis of primary tumors and metastasis. Volcano plot filtering shows differentially expressed genes between primary tumors (n = 1,090) and metastasis (n = 7). Three genes (HDAC2, TP53, UPA), that are highlighted above the horizontal line (statistical significance boundary of p < 0.05) were significantly upregulated in primary tumors.
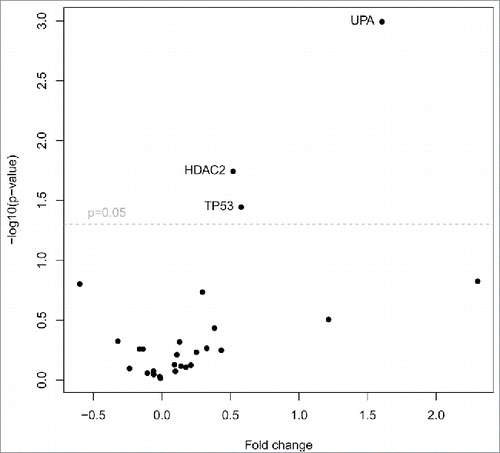
Figure 5. TCGA data analysis of primary tumors and metastasis. Volcano plot filtering shows differentially expressed genes between primary tumors (n = 1,090) and metastasis (n = 7). Three genes (HDAC2, TP53, UPA), that are highlighted above the horizontal line (statistical significance boundary of p < 0.05) were significantly upregulated in primary tumors.

Figure 6. Prognostic relevance of the CTCs gene signature. Six independent Kaplan–Meier curves show the comparison of overall-survival and relapse-free survival in independent cohort of breast cancer patients (TCGA data set) and confirmed that high expression of the genes studied is associated with poor patient's outcome. Red curves: high gene expression; black curves: low gene expression; p values from log-rank tests comparing the two KM curves are shown at the bottom of each plot.
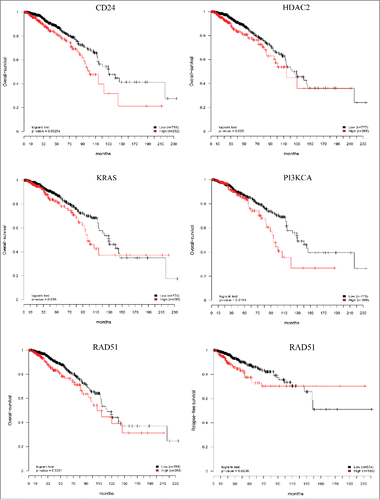
Figure 6. Prognostic relevance of the CTCs gene signature. Six independent Kaplan–Meier curves show the comparison of overall-survival and relapse-free survival in independent cohort of breast cancer patients (TCGA data set) and confirmed that high expression of the genes studied is associated with poor patient's outcome. Red curves: high gene expression; black curves: low gene expression; p values from log-rank tests comparing the two KM curves are shown at the bottom of each plot.

Table 1. Clinicopathological parameters of all patients enrolled in the study. Patient group (n = 147); median age: 47 years; age range: 24–84 years.

Supplemental material

KONI_A_1102827_Supplementary.zip

Download Zip (116.1 KB)