Figures & data
Figure 1. The CD68 and CSF1 expression in colon cancer tissue. (A) Numbers of CD68+ cells in normal mucosa, peritumoral or intratumoral stoma of 46 cases of primary colon cancer. Each symbol represented one tissue sample. (B) The correlation of infiltrated CD68+ cell number between normal tissue and intratumoral stroma (upper) and peritumoral and intratumoral stroma (down). (C) (Upper) A typical view of CSF1 expression in peritumoral and tumor tissue in colon cancer (small: 100×; large: 400×). (Down) The percentage of CSF1-high cases in normal and tumor samples. (D) A typical CD68 and CSF1 expression in two consecutive sections (small: 100×; large: 400×). (E) The correlation between CD68+ cell numbers and CSF1 expression score in each tumor sample. **p < 0.01
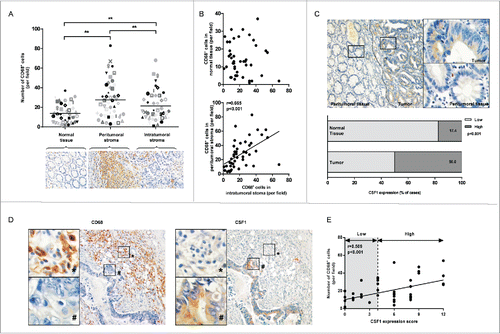
Table 1. 5-y overall survival according to clinicopathological parameters.
Figure 2. Survival of colon cancer patients categorized by CSF1 and CD68 expression. (A) All colon cancer cases in tissue microarray with follow-up data (n=90) were categorized according to expression of CSF1 (left) and CD68 (right) respectively, and survival analysis between two subgroups was performed. (B) Survival analysis was performed between subgroups based on a prognostic score combined with CSF1 and CD68. Low: CSF1loCD68lo; Intermediate: CSFloCD68hi/CSFhiCD68lo; High: CSF1hiCD68hi. Survival curves were plotted by Kaplan–Meier method and the log-rank test was used to determine statistical significance.
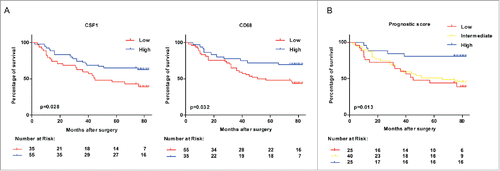
Table 2. Cox proportional hazard model in 90 colon cancer cases.
Table 3. Intratumoral CSF1 and CD68 expression in relation to clinicopathological parameters of colon cancer patients.
Figure 3. Co-culture with THP-1-derived macrophages promoted CSF1 production in HT-29 colon cancer cells. (A) A diagrammatic illustration for the co-culture procedure. Upper: To obtain the co-culture medium, 2×10⁵ of HT-29 cells were co-cultured with intended numbers of THP-1-derived macrophages for 24 h, then the co-culture medium and cells were collected and measured separately. Down: To obtain conditioned medium (CM), HT-29 cells and THP-1-derived macrophages were cultured alone in new medium for another 24 h after co-culture, then the CM were collected. (B) CSF1 concentration in THP-1-derived macrophages, HT-29 cells and co-culture medium for 12 h and 24 h. Mφ, the CM of THP-1-derived macrophages alone; HT-29, the CM of HT-29 cells alone; Mφ+HT-29, the co-culture medium of THP-1-derived macrophages and HT-29 cells. (C) CSF1 transcription in THP-1-derived macrophages and HT-29 cells after intended period of co-culture. (D) CSF1 concentration in CM of THP-1-derived macrophages and HT-29 cells, alone or 24 h after the co-culture. (E) CSF1 transcription in THP-1-derived macrophages and HT-29 cells co-cultured in different cell ratio. All subgroups were compared to the control. (F) A typical immunofluorescent image for CSF1 expression pattern in HT-29 cells, alone or after 24 h of co-culture with macrophages. Mφ represented THP-1-derived macrophages. The RT-PCR data were normalized to the control and shown as fold change. Each bar represents the mean±SD (n = 3, *p < 0.05, **p < 0.01).
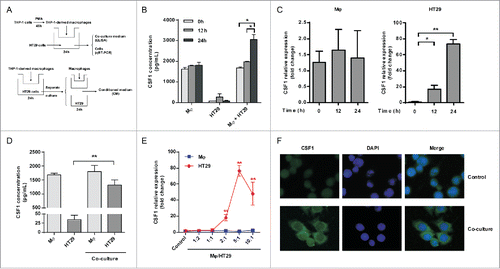
Figure 4. IL-8 promoted CSF1 in HT-29 cells via PKC pathway. (A and B) IL-8 transcription (A) and concentration in CM (B) of THP-1-derived macrophages and HT-29 cells, alone or after co-culture. (C) THP-1-derived macrophages and HT-29 cells were cultured alone or co-cultured with/without IL-8 NAb (2 μg/mL) for 24 h. Then cells were collected respectively and CSF1 transcription was measured. (D) HT-29 cells were co-cultured with THP-1-derived macrophages with/without IL-8 NAb (2 μg/mL) for 24 h, then were cultured alone in new medium for another 24 h. CSF1 concentration in HT-29 CM was measured. (E) HT-29 cells were treated by phorbol 12-myristate 13-acetate (PMA, 100 ng/mL) for 24 h, and CSF1 transcription was measured. (F) HT-29 cells co-cultured with THP-1-derived macrophages with/without IL-8 NAb were measured for phosphorylation of PKC isoforms. Mφ represented THP-1-derived macrophages. The qRT-PCR data were normalized to the control and shown as fold change. Each bar represents the mean ± SD (n = 3, *p < 0.05, **p< 0.01).
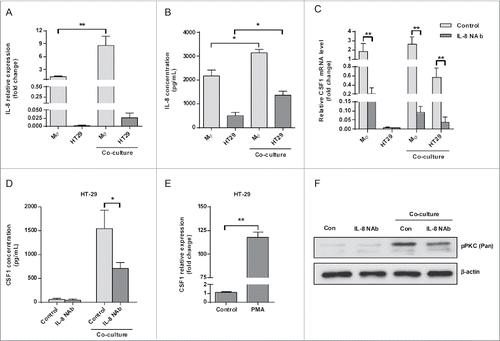
Figure 5. HT-29-derived CSF1 recruited THP-1-derived macrophages and directed their cytokines/chemokines production. (A) The CM of THP-1-derived macrophages and HT-29 cells were applied to Transwell assay, and numbers of THP-1-derived macrophages recruited by CM were counted. The SW480 CM was used as a negative control for cancer cell-derived CSF1. (B) The HT-29 CM, alone or co-cultured, were applied for Transwell assay, with/without CSF1 NAb (100 ng/mL), and recruited THP-1-derived macrophages were counted. (C) The CM of HT-29 transfected by control or CSF-shRNA were used for Transwell assay. The recruited THP-1-derived macrophages were counted. (D) THP-1-derived macrophages were co-cultured with HT-29 cells transfected by control or CSF1-shRNA for 24 h, and the transcription of typical pro- or anti-inflammatory cytokines/chemokines was measured. The cytokines/chemokines with significant change were exhibited. Mφ-HT-29: HT-29 CM after 24 h of co-culture; Mφ-SW480: SW480 CM after 24 h of co-culture. The qRT-PCR data were normalized to the control and shown as fold change. Each bar represents the mean ± SD (n = 3, *p < 0.05, **p< 0.01).
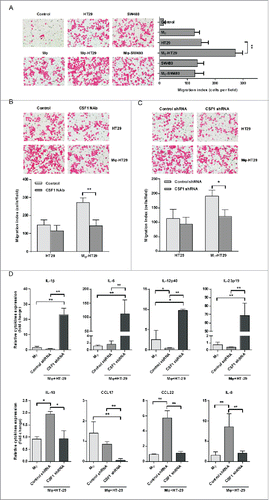
Figure 6. Adenovirus-mediated intratumoral CSF1 over-expression affected macrophages infiltration and tumor growth in vivo. (A) A diagrammatic illustration for the tumor model study procedure. 1 × 10⁷ HT-29 cells in 100 μL RPMI 1640 medium was subcutaneously injected into bilateral legs of BALB/c nude mice. After 12 d of tumor inoculation, recombinant adenovirus vector expressing human CSF1 (Ad-hCSF1) or control vector (both 5 × 10¹⁰ vp/100 μL) was injected into the right tumor. Mice were sacrificed and tumors were isolated on day 27. (B) (Left) Typical views of CD68+ cells in tumor xenografts treated with control vector or Ad-hCSF1 (400×). (Right) The mean number of CD68+ cells infiltrated in tumor. (C) mRNA levels of human CSF1 (upper) and mouse IL-8 (down) in right tumors of two groups were analyzed after 15 d of adenovirus vector injection. (D) Tumor volume in two groups was measured every 3 d and statistical analysis was performed. Tumor volumes were calculated as (length × width2)/2. (E) Mean colon cancer xenograft weights on day 27, treated with control vector or Ad-hCSF1. Data were represented as mean ± SD (n = 5, *p < 0.05, ** p < 0.01).
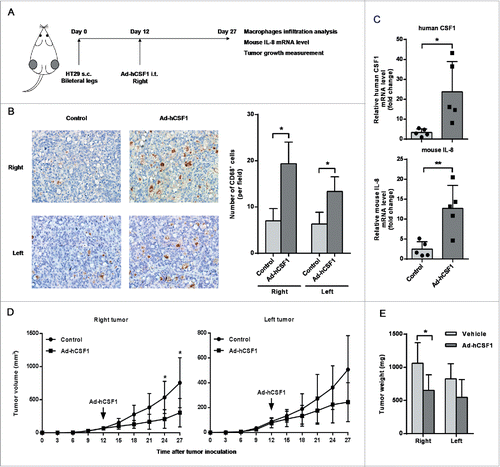
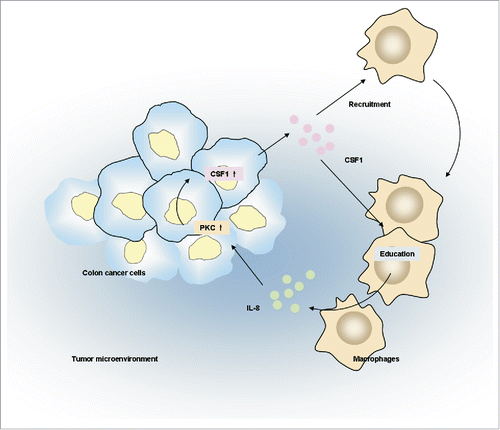
Figure 7. The schematic diagram depicting interactions between colon cancer cells and tumor infiltrated macrophages depending on CSF1.