1,553
Views
20
CrossRef citations to date
0
Altmetric
ORIGINAL RESEARCH

Ipilimumab reshapes T cell memory subsets in melanoma patients with clinical response

, , , , , , , , , , , , , , & show all
Article: 1136045 | Received 07 Oct 2015, Accepted 18 Dec 2015, Published online: 11 Jul 2016

Figures & data

Table 1. Patients characteristics. The whole cohort is described as well as the two groups of patients treated or not with the full course of four cures of ipilimumab. Adverse events were graded according to the National Cancer Institute's Common Terminology Criteria for Adverse Events (version 4.0).

Figure 1. Patients immunological status at the baseline. Percentages of CD4+ (A) and CD8+ (B) T cell subsets (CM for central memory, EM for effector memory, EMRA for terminally effector memory, GzmB for Granzyme B). Results from HD and patients are shown as open bars and black bars respectively. *for p < 0.05, ** for p < 0.01, *** for p < 0.001 and **** for p < 0.0001. (C) Kaplan–Meier survival curves from patients with ALC ≥ 1 × 10⁹/L (gray line, n = 43) or < 1 × 10⁹/L (black line, n = 26) at the baseline.
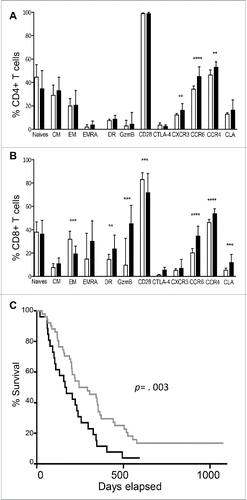
Figure 1. Patients immunological status at the baseline. Percentages of CD4+ (A) and CD8+ (B) T cell subsets (CM for central memory, EM for effector memory, EMRA for terminally effector memory, GzmB for Granzyme B). Results from HD and patients are shown as open bars and black bars respectively. *for p < 0.05, ** for p < 0.01, *** for p < 0.001 and **** for p < 0.0001. (C) Kaplan–Meier survival curves from patients with ALC ≥ 1 × 10⁹/L (gray line, n = 43) or < 1 × 10⁹/L (black line, n = 26) at the baseline.

Figure 2. Ipilimumab induces activated and memory T cells. The two slope model is visualized by the black line. CD4+ and CD8+ T cell subsets are presented in the left and the right panels respectively. (A) Percentage of HLA-DR+ T cells, absolute counts per mm3 of (B) CM, (C) EM and (D) EMRA. The same results are observed in terms of percentages of parental subsets (data not shown). *for p < 0.05, ** for p < 0.01, *** for p < 0.001 and **** for p < 0.0001.
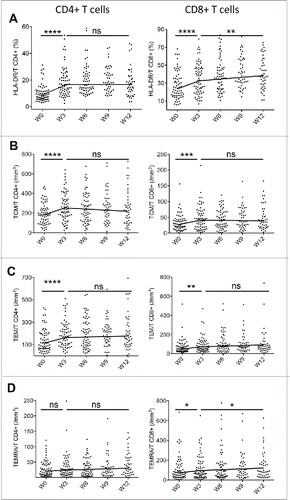
Figure 2. Ipilimumab induces activated and memory T cells. The two slope model is visualized by the black line. CD4+ and CD8+ T cell subsets are presented in the left and the right panels respectively. (A) Percentage of HLA-DR+ T cells, absolute counts per mm3 of (B) CM, (C) EM and (D) EMRA. The same results are observed in terms of percentages of parental subsets (data not shown). *for p < 0.05, ** for p < 0.01, *** for p < 0.001 and **** for p < 0.0001.

Figure 3. Pharmacodynamic changes during ipilimumab therapy. Expression of eomes on CD4+ and CD8+ T cells (A), T-bet (B) and CD122 (C) on. Cytotoxic markers expression (GzmB and TNF-a) on CD8+ T cells (D). Evolution of chemokine receptor expression in T cells (E). Note: T-bet and GzmB were evaluated on 20 patients as mentioned in material and method section. *for p < 0.05, ** for p < 0.01, *** for p < 0.001 and **** for p < 0.0001.
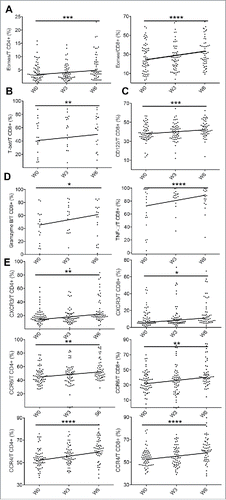
Figure 3. Pharmacodynamic changes during ipilimumab therapy. Expression of eomes on CD4+ and CD8+ T cells (A), T-bet (B) and CD122 (C) on. Cytotoxic markers expression (GzmB and TNF-a) on CD8+ T cells (D). Evolution of chemokine receptor expression in T cells (E). Note: T-bet and GzmB were evaluated on 20 patients as mentioned in material and method section. *for p < 0.05, ** for p < 0.01, *** for p < 0.001 and **** for p < 0.0001.

Figure 4. CTLA-4 blockade and markers associated with clinical response. Patients were subdivided in two groups, DC (gray line and dots) and NR (black line and dots). Clinical benefit is associated with a more marked increase of memory subsets (A and B) and of eomes expressing CD8+ T cells (C). *for p < 0.05, ** for p < 0.01
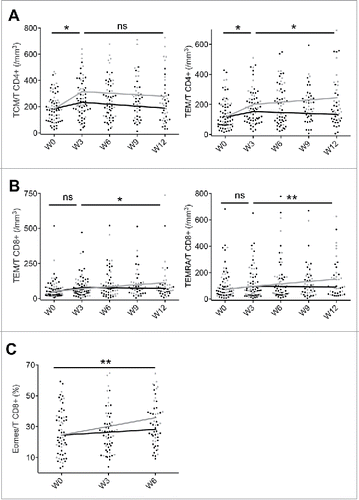
Figure 4. CTLA-4 blockade and markers associated with clinical response. Patients were subdivided in two groups, DC (gray line and dots) and NR (black line and dots). Clinical benefit is associated with a more marked increase of memory subsets (A and B) and of eomes expressing CD8+ T cells (C). *for p < 0.05, ** for p < 0.01
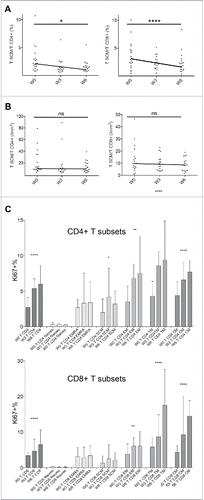
Figure 5. Ipilimumab induces a dynamic interplay between TSCM and classical memory T cells. Among memory subsets, only TSCM decrease in percentages (A) with constant absolute counts (B). The proliferative capacity of naïve, memory and TSCM subsets was assessed by Ki67 expression (C).

Figure 5. Ipilimumab induces a dynamic interplay between TSCM and classical memory T cells. Among memory subsets, only TSCM decrease in percentages (A) with constant absolute counts (B). The proliferative capacity of naïve, memory and TSCM subsets was assessed by Ki67 expression (C).
Supplemental material

KONI_A_1136045_s02-s04.zip

Download Zip (538.8 KB)

Reprints and Corporate Permissions

Please note: Selecting permissions does not provide access to the full text of the article, please see our help page How do I view content?

To request a reprint or corporate permissions for this article, please click on the relevant link below:

Academic Permissions

Please note: Selecting permissions does not provide access to the full text of the article, please see our help page How do I view content?

Obtain permissions instantly via Rightslink by clicking on the button below:

If you are unable to obtain permissions via Rightslink, please complete and submit this Permissions form. For more information, please visit our Permissions help page.