Figures & data
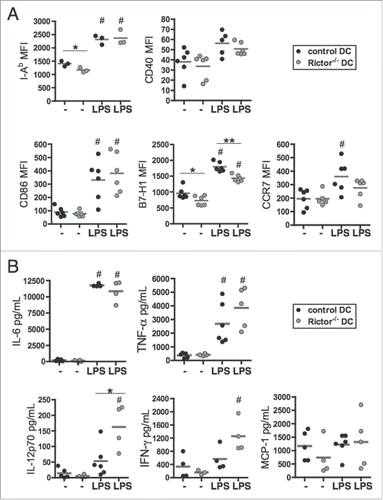
Figure 1. Rictor−/− BMDC display pro-inflammatory properties. (A) CD11c+-gated BMDC were analyzed for cell surface MHC class-II (I-Ab), CD40, CD86, B7-H1 (PD-L1) and CCR7 expression by flow cytometry following 6 d culture in the absence of stimulation (−) or after LPS stimulation (LPS) for the last 18 h of culture. Plots show the means and individual values of n = 3–6 mice. (B) Cytokine levels in supernatants were assessed by cytokine bead array (IL-6, TNFα, MCP-1) or ELISA (IL-12p70 and IFNγ). Data are from n = 4–6 mice. #p < 0.05 compared to corresponding non-stimulated cells; *p < 0.05 and **p < 0.01 between control and Rictor−/− DC.

Figure 2. I.t. injection of LPS-activated Rictor−/− DC markedly reduces B16 melanoma growth. C57BL/6 mice bearing day 7 s.c. B16 melanomas were given an i.t. injection of 106 control DC or Rictor−/− DC, that was repeated at day 14 post-tumor inoculation. Tumor growth was monitored every 3–4 d and is shown as mean + SD for five animals per group. p < 0.05 when comparing Rictor−/− DC-injected mice with untreated or control DC-injected mice.

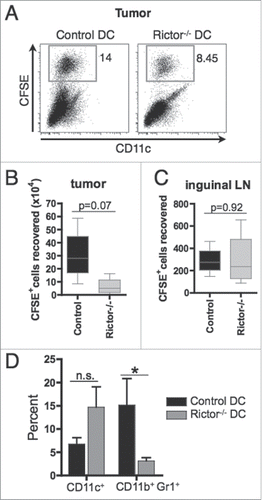
Figure 3. I.t.-delivered rictor−/− DC show similar migration to draining lymphoid tissue, but reduce the frequency of MDSC within the tumor. 5 × 10⁶ CFSE-labeled control DC or Rictor−/− DC were injected i.t. on day 7 post-tumor inoculation in B16-melanoma-bearing B6 mice. After 3 d, tumors, spleens and tumor-draining inguinal lymph nodes were harvested and cells isolated. (A) Plots show the percentages of CFSE+ DC recovered from the tumor. (B, C) Absolute numbers of CFSE+ DC recovered from the tumor (B) and inguinal lymph nodes (C). Box plots show median, 25%- and 75%-quartiles, and both extreme values. (D) Percent CD11c+ and CD11b+Gr1+ cells in the tumor shown as means + SD for three animals per group. *p < 0.05.

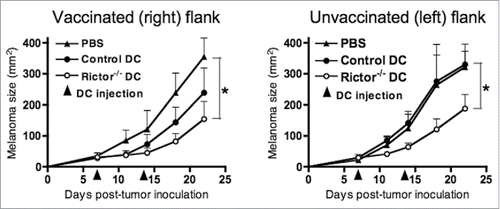
Figure 4. I.t.-delivery of Rictor−/− DC results in a therapeutic antitumor response in a contralateral tumor site. Mice bearing 7-d B16 tumors in each flank, with similar mean total tumor sizes, were injected with 50 µL of PBS or 50 µL of PBS containing 106 control DC or 106 Rictor−/− DC on the right flanks. Tumors on the left flank of each animal were left untreated. Animals received an identical treatment on day 14 post-tumor implantation. Treated and untreated tumor sizes (in mm2) for each animal were then monitored longitudinally every 3–4 d, and are reported as means + SD for five animals per group. *p < 0.05.

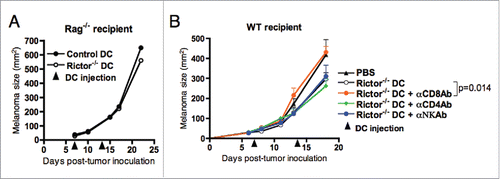
Figure 5. Reduction of B16 melanoma growth is dependent mainly on CD8+ T cells. (A) Rag1−/− mice bearing day 7 s.c. B16 melanomas were given i.t. injections of 106 control DC or Rictor−/− DC. DC injection was repeated at day 14 post-tumor inoculation. Tumor growth was monitored every 3–4 d and is shown as means + SD for five animals per group. (B) C57BL/6 mice bearing s.c. B16 melanomas were treated on days 7 and 14 post-tumor inoculation by i.t. injection of 106 Rictor−/− DC. On days 6, 13, and 20 after tumor inoculation, different groups of mice were injected i.p. with control IgG, anti-CD4, anti-CD8+, or anti-NK Ab to specifically deplete these cell populations in vivo. Tumor growth was monitored every 3–4 d and is reported as mean + SD for five animals per group.

Figure 6. Rictor−/− DC administration promotes increased frequencies of tumor-infiltrating cytotoxic T cells. C57BL/6 mice bearing s.c. B16 melanomas were injected i.t. at days 7 and 14 post-tumor inoculation with 106 control DC or Rictor−/− DC. At day 21 post-tumor inoculation, tumors were harvested and tumor-infiltrating lymphocytes obtained and stained for the indicated surface markers and intracellular cytokines. (A) Plots show absolute numbers of CD4+ and CD8+ tumor-infiltrating T cells divided by the respective tumor weight. (B) Frequencies of IFNγ+, IL-17+ and CD25+Foxp3+ cells in the total CD4+ T cell population. (C) Frequencies of IFNγ+, granzyme-B+ and PD-1+ cells in the total CD8+ T cell population. Data are shown as means + SD for three to four animals per group, and two independent experiments. *p < 0.05 and **p < 0.01.

Figure 7. Rictor−/− DC administration enhances activation of antitumor CD8+ T cells in the periphery. C57BL/6 mice bearing s.c. B16 melanomas were treated at days 7 and 14 post-tumor inoculation with i.t. injection of 106 control DC or Rictor−/− DC. At day 21 post-tumor inoculation, spleens were harvested and (A, B, C) splenocytes stained with CFSE and then stimulated with irradiated (100 Gy) B16 cells (ratio 10:1 respectively) in the presence of 30 IU/mL recombinant human IL-2 for 5 d in 24-well culture plates. (A, B) Responder T cells were analyzed for CD8+ and intracellular IFNγ and granzyme-B, showing (A) representative plots and (B) means + SD for six animals per group reported from three independent experiments performed. (C) Cell-free supernatants of these cultures were analyzed for IFNγ, IL-6 and TNF-α. Box plots show median, 25%- and 75%-quartiles, and both extreme values. (D, E) Splenic CD8+ T cells isolated from untreated (PBS), control-DC- or Rictor−/− DC-treated mice were cultured with CFSE-labeled B16 melanoma cells and violet-labeled irrelevant control EL4 thymoma cells at ratios of 5:1:1, 2:1:1 or 1:1:1 (where a unit of 1 = 5 × 10⁴ cells) for 18 h. Cells were analyzed by flow cytometry to determine the percentage of viable B16 (green) or EL4 (violet) cells, as shown in (D), versus a control consisting of a 1:1 mixture of each of the labeled tumor cell lines in the absence of T cells. (E) Results are reported as means +/− SD of data obtained from five mice/cohort. Percent killing was determined based on the formula: 100% × [1 – (percentage of viable tumor cells in the presence of T cells/percentage of viable tumor cells in the absence of T cells)]. *p < 0.05, **p < 0.01, ***p < 0.001.
![Figure 7. Rictor−/− DC administration enhances activation of antitumor CD8+ T cells in the periphery. C57BL/6 mice bearing s.c. B16 melanomas were treated at days 7 and 14 post-tumor inoculation with i.t. injection of 106 control DC or Rictor−/− DC. At day 21 post-tumor inoculation, spleens were harvested and (A, B, C) splenocytes stained with CFSE and then stimulated with irradiated (100 Gy) B16 cells (ratio 10:1 respectively) in the presence of 30 IU/mL recombinant human IL-2 for 5 d in 24-well culture plates. (A, B) Responder T cells were analyzed for CD8+ and intracellular IFNγ and granzyme-B, showing (A) representative plots and (B) means + SD for six animals per group reported from three independent experiments performed. (C) Cell-free supernatants of these cultures were analyzed for IFNγ, IL-6 and TNF-α. Box plots show median, 25%- and 75%-quartiles, and both extreme values. (D, E) Splenic CD8+ T cells isolated from untreated (PBS), control-DC- or Rictor−/− DC-treated mice were cultured with CFSE-labeled B16 melanoma cells and violet-labeled irrelevant control EL4 thymoma cells at ratios of 5:1:1, 2:1:1 or 1:1:1 (where a unit of 1 = 5 × 10⁴ cells) for 18 h. Cells were analyzed by flow cytometry to determine the percentage of viable B16 (green) or EL4 (violet) cells, as shown in (D), versus a control consisting of a 1:1 mixture of each of the labeled tumor cell lines in the absence of T cells. (E) Results are reported as means +/− SD of data obtained from five mice/cohort. Percent killing was determined based on the formula: 100% × [1 – (percentage of viable tumor cells in the presence of T cells/percentage of viable tumor cells in the absence of T cells)]. *p < 0.05, **p < 0.01, ***p < 0.001.](/cms/asset/8e59c3af-4a3d-40c8-952d-bfa19769f9af/koni_a_1146841_f0007_b.gif)
