2,793
Views
24
CrossRef citations to date
0
Altmetric
Original Research

Ranitidine modifies myeloid cell populations and inhibits breast tumor development and spread in mice

, , , , &
Article: e1151591 | Received 27 Jul 2015, Accepted 02 Feb 2016, Published online: 01 Jul 2016

Figures & data

Figure 1. Ranitidine treatment decreases CD11b+Ly6Chi population in the spleen and bone marrow of BALB/c mice. Composition of total CD11b+ cells, Ly6G+Ly6Clo granulocytic cells, and Ly6Chi monocytic cells in spleen (A) and bone marrow (B) of non-tumor-bearing mice with and without 8 d of ranitidine treatment. (C) Representative flow cytometry data showing percentages of Ly6G+Ly6Clo and Ly6Chi in CD11b+ splenocytes. Data points represent individual mice and line represents the mean per group. p < 0.05, p < 0.001, unpaired t-test.
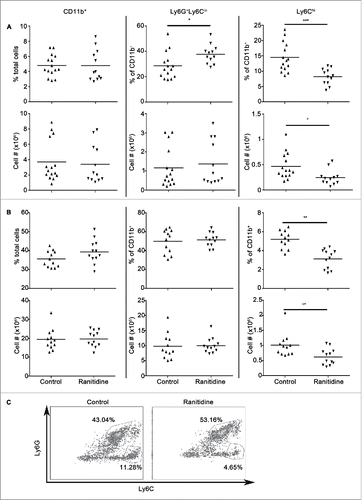
Figure 1. Ranitidine treatment decreases CD11b+Ly6Chi population in the spleen and bone marrow of BALB/c mice. Composition of total CD11b+ cells, Ly6G+Ly6Clo granulocytic cells, and Ly6Chi monocytic cells in spleen (A) and bone marrow (B) of non-tumor-bearing mice with and without 8 d of ranitidine treatment. (C) Representative flow cytometry data showing percentages of Ly6G+Ly6Clo and Ly6Chi in CD11b+ splenocytes. Data points represent individual mice and line represents the mean per group. p < 0.05, p < 0.001, unpaired t-test.

Figure 2. Ranitidine treatment decreases CD11b+Ly6Chi population in the spleen of 4T1 tumor-bearing BALB/c mice. Composition of total CD11b+ cells, Ly6G+Ly6Clo granulocytic cells, and Ly6Chi monocytic cells in spleen of 4T1 tumor-bearing mice with and without 8 d ranitidine treatment, starting one day prior to tumor cell injection. Data points represent individual mice and line represents the mean per group. p <0.05, p <0.01, unpaired t-test.
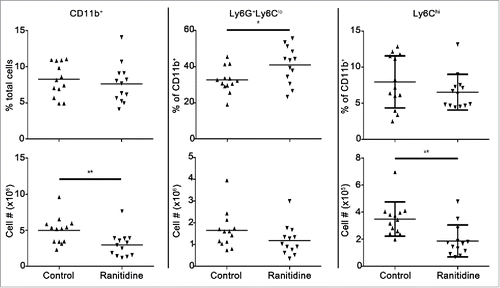
Figure 2. Ranitidine treatment decreases CD11b+Ly6Chi population in the spleen of 4T1 tumor-bearing BALB/c mice. Composition of total CD11b+ cells, Ly6G+Ly6Clo granulocytic cells, and Ly6Chi monocytic cells in spleen of 4T1 tumor-bearing mice with and without 8 d ranitidine treatment, starting one day prior to tumor cell injection. Data points represent individual mice and line represents the mean per group. p <0.05, p <0.01, unpaired t-test.

Figure 3. Histamine receptor antagonists inhibit 4T1 metastasis. (A) Average number of 4T1 colonies derived from lungs of tumor-bearing BALB/c mice treated with ranitidine (8 mg/kg), famotidine (□ 8mg/kg and ⊠ 2mg/kg), pyrilamine (10 mg/kg), and cetirizine (10 mg/kg). (B) Number of 4T1 colonies derived from lungs of tumor-bearing mice treated with decreasing doses of ranitidine. Data points in (A) represent mean of 3–4 mice per group per experiment; data in (B) represent mean ± SEM of 3–42 mice. p < 0.05, p < 0.01, paired t-test (A), ANOVA followed by a Dunnett's test (B).
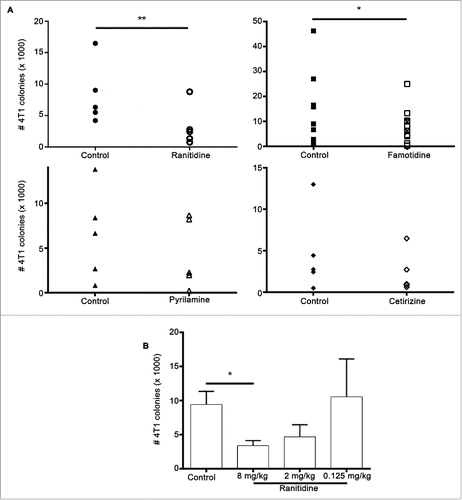
Figure 3. Histamine receptor antagonists inhibit 4T1 metastasis. (A) Average number of 4T1 colonies derived from lungs of tumor-bearing BALB/c mice treated with ranitidine (8 mg/kg), famotidine (□ 8mg/kg and ⊠ 2mg/kg), pyrilamine (10 mg/kg), and cetirizine (10 mg/kg). (B) Number of 4T1 colonies derived from lungs of tumor-bearing mice treated with decreasing doses of ranitidine. Data points in (A) represent mean of 3–4 mice per group per experiment; data in (B) represent mean ± SEM of 3–42 mice. p < 0.05, p < 0.01, paired t-test (A), ANOVA followed by a Dunnett's test (B).

Figure 4. Ranitidine does not affect lung metastases by directly affecting CD8+ activity. (A) Final tumor weight of ranitidine treated mice with and without CD8+ depletion. (B) Number of 4T1 cell colonies that developed from lungs of tumor bearing BALB/c mice treated with ranitidine with and without CD8+ depletion. Data from (A) represent average of individual mice and line represents mean per group. Data in (B) represents mean ± SEM of 6–12 mice per group.
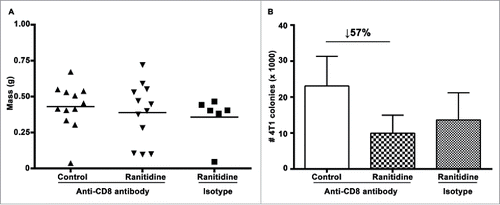
Figure 4. Ranitidine does not affect lung metastases by directly affecting CD8+ activity. (A) Final tumor weight of ranitidine treated mice with and without CD8+ depletion. (B) Number of 4T1 cell colonies that developed from lungs of tumor bearing BALB/c mice treated with ranitidine with and without CD8+ depletion. Data from (A) represent average of individual mice and line represents mean per group. Data in (B) represents mean ± SEM of 6–12 mice per group.

Figure 5. Peripheral blood leukocytes from ranitidine-treated tumor-bearing mice have decreased suppressive functions. Peripheral blood leukocytes from 4T1 tumor-bearing mice with and without treatment were isolated and plated with Oregon Green-labeled D011.10 splenocytes with ova323-339. After 3 d incubation, proliferation was measured. Data points in (A) represents mean ± SEM of 9 mice. (B) Representative data of one mouse/treatment. Gray histogram represent unstimulated Oregon Green+CD4+ cells. p < 0.05, p < 0.01, unpaired t-test.
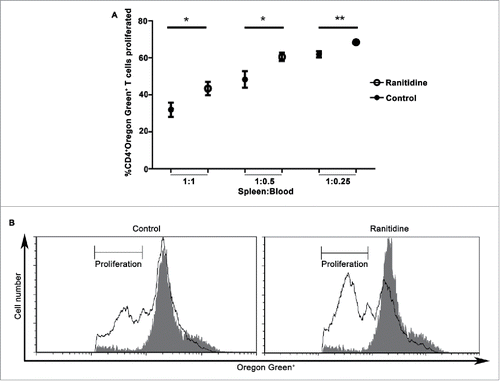
Figure 5. Peripheral blood leukocytes from ranitidine-treated tumor-bearing mice have decreased suppressive functions. Peripheral blood leukocytes from 4T1 tumor-bearing mice with and without treatment were isolated and plated with Oregon Green-labeled D011.10 splenocytes with ova323-339. After 3 d incubation, proliferation was measured. Data points in (A) represents mean ± SEM of 9 mice. (B) Representative data of one mouse/treatment. Gray histogram represent unstimulated Oregon Green+CD4+ cells. p < 0.05, p < 0.01, unpaired t-test.

Figure 6. Ranitidine treatment decreases E0771-GFP tumor growth. (A) E0771 tumors in C57BL/6 mice treated with ranitidine (8 mg/kg) were measured every 2 d starting 7 d post E0771-GFP cell injection. (B) At day 21, the primary tumor was excised and weighed. Data in (A) represents the mean ± SEM tumor volume of 11–12 mice/point. Data points in (B) represent final tumor weight of individual mice. p < 0.05, unpaired t-test.
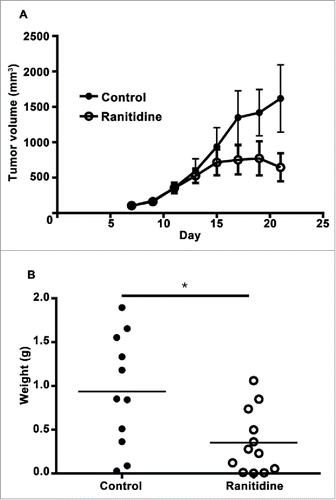
Figure 6. Ranitidine treatment decreases E0771-GFP tumor growth. (A) E0771 tumors in C57BL/6 mice treated with ranitidine (8 mg/kg) were measured every 2 d starting 7 d post E0771-GFP cell injection. (B) At day 21, the primary tumor was excised and weighed. Data in (A) represents the mean ± SEM tumor volume of 11–12 mice/point. Data points in (B) represent final tumor weight of individual mice. p < 0.05, unpaired t-test.

Figure 7. Omeprazole treatment does not alter E0771-GFP tumor development. (A) E0771 tumors in C57BL/6 mice treated with omeprazole (1.275 mg/d in mash) were measured every 2 d starting 7 d post E0771-GFP cell injection. (B) At day 20, the primary tumor was excised and weighed. Data in (A) represents the mean ± SEM tumor volume of 10 mice/point. Data points in (B) represent final tumor weight of individual mice.
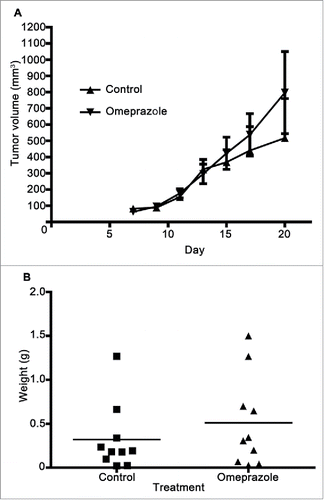
Figure 7. Omeprazole treatment does not alter E0771-GFP tumor development. (A) E0771 tumors in C57BL/6 mice treated with omeprazole (1.275 mg/d in mash) were measured every 2 d starting 7 d post E0771-GFP cell injection. (B) At day 20, the primary tumor was excised and weighed. Data in (A) represents the mean ± SEM tumor volume of 10 mice/point. Data points in (B) represent final tumor weight of individual mice.

Figure 8. Gemcitabine treatment prevents ranitidine-induced tumor growth inhibition. (A) Blood samples were taken from each mouse one day after gemcitabine (or vehicle) injection and stained for myeloid cells. (B) E0771 tumors in C57BL/6 mice treated with ranitidine (8 mg/kg) with/without gemcitabine treatment were measured every 2 d starting 7 d post E0771-GFP cell injection. (C–D) At day 20, the primary tumor was measured (C), excised and weighed (D). Data in (A) represents the mean ± SEM of 4–8 mice/group. Data in (B) represents the mean ± SEM tumor volume of 12–24 mice/point. Data points in (C–D) represent the mean ± SEM of 12–24 mice/group.
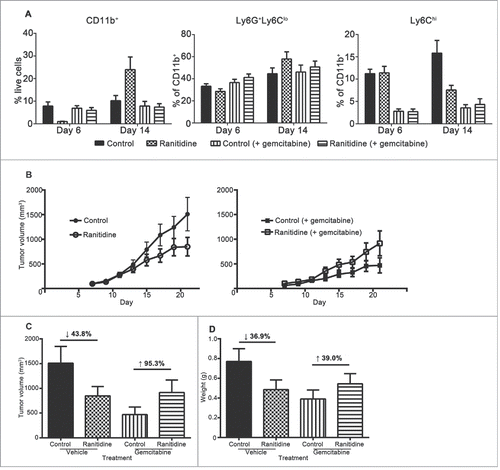
Figure 8. Gemcitabine treatment prevents ranitidine-induced tumor growth inhibition. (A) Blood samples were taken from each mouse one day after gemcitabine (or vehicle) injection and stained for myeloid cells. (B) E0771 tumors in C57BL/6 mice treated with ranitidine (8 mg/kg) with/without gemcitabine treatment were measured every 2 d starting 7 d post E0771-GFP cell injection. (C–D) At day 20, the primary tumor was measured (C), excised and weighed (D). Data in (A) represents the mean ± SEM of 4–8 mice/group. Data in (B) represents the mean ± SEM tumor volume of 12–24 mice/point. Data points in (C–D) represent the mean ± SEM of 12–24 mice/group.

Figure 9. Ranitidine increased breast tumor onset latency and decreases final tumor numbers in LKB1−/−/NIC mice. (A) Representative timeline of experiment. (B) Mice were examined weekly for palpable breast tumors. (C) Endpoint number of tumors was counted. (B) Representative tumor-free survival of control (n=15) and ranitidine-treated (n=10) mice. Data points in (C) represent number of tumors in individual mice. p < 0.001, Log rank test (B); p < 0.01, unpaired t-test (C).
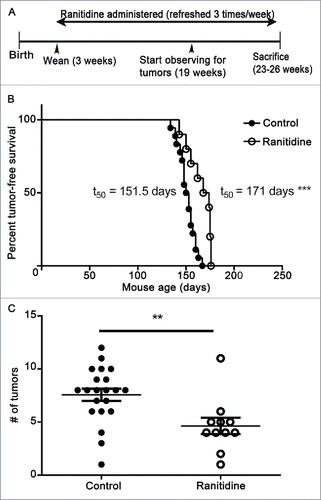
Figure 9. Ranitidine increased breast tumor onset latency and decreases final tumor numbers in LKB1−/−/NIC mice. (A) Representative timeline of experiment. (B) Mice were examined weekly for palpable breast tumors. (C) Endpoint number of tumors was counted. (B) Representative tumor-free survival of control (n=15) and ranitidine-treated (n=10) mice. Data points in (C) represent number of tumors in individual mice. p < 0.001, Log rank test (B); p < 0.01, unpaired t-test (C).
Supplemental material

KONI_A_1151591_s02.zip

Download Zip (2.8 MB)