
Figures & data
Table 2. Specific IgE scores in CALAB and corresponding serum concentrations.
Table 1. Characteristics of study participants by IgE sensitization status.
Table 3. Associations between IgE sensitization, serum specific IgE scores and risk of incident cancer overall and by sex with chronological age as timescale.
Table 4. Associations between IgE sensitization, serum specific IgE scores and risk of site-specific cancers by sex with chronological age as timescale.
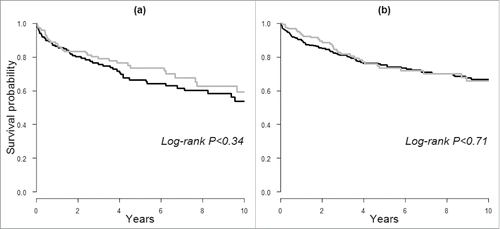
Figure 1. Kaplan–Meier curves of 10-y survival following cancer diagnosis in (A) men and (B) women based on prediagnostic IgE sensitization. Black lines indicate IgE sensitization and the gray lines indicate a lack thereof.
Supplemental material