1,405
Views
27
CrossRef citations to date
0
Altmetric
Original Research

Extracellular HSP110 skews macrophage polarization in colorectal cancer

, , , , , , , , , , , & show all
Article: e1170264 | Received 23 Nov 2015, Accepted 19 Mar 2016, Published online: 29 Jun 2016

Figures & data

Figure 1. Pro-tumoral macrophages invade tumor bed in CRC expressing high levels of HSP110 (HSP110high) A, B Expression of HSP110 (A), CD68 and CD163 (B) by IHC in stroma of tumor samples from MSI CRC patients belonging to the HSP110high and HSP110 low groups described by Collura et al (reference 4). One representative image is shown (n = 5) Brown color indicates positive staining (200x magnification for A, scale bars, 50 μm. 100x magnification for B, scale bars, 100 μm). (C) Number of CD163 macrophages in tumors biopsy stroma was determined ( p = 0.0025, n = 5) (value for each patient was determined as the average number of stained cells in three distinct sections. (D) Indicated HSPs were analyzed by Immunoblot in HCT116 and HCT116-C22 cells. HSC70 was used as a loading control. (E) Expression of F4/80, iNOS and Arginase by IHC from tumor sections of mice xenografted with HCT116 or HCT116-C22 (One image representative of six mice in each group, 20x magnification, scale bars 40 μm). (F, G) qPCR analysis of Arginase, iNOS mRNA (F) and TNFa (G) from tumor sections of mice xenografted with HCT116 or HCT116-C22. **p < 0.01, ***p < 0.005.
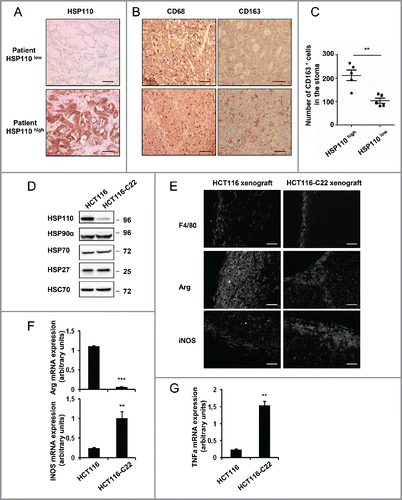
Figure 1. Pro-tumoral macrophages invade tumor bed in CRC expressing high levels of HSP110 (HSP110high) A, B Expression of HSP110 (A), CD68 and CD163 (B) by IHC in stroma of tumor samples from MSI CRC patients belonging to the HSP110high and HSP110 low groups described by Collura et al (reference 4). One representative image is shown (n = 5) Brown color indicates positive staining (200x magnification for A, scale bars, 50 μm. 100x magnification for B, scale bars, 100 μm). (C) Number of CD163 macrophages in tumors biopsy stroma was determined ( p = 0.0025, n = 5) (value for each patient was determined as the average number of stained cells in three distinct sections. (D) Indicated HSPs were analyzed by Immunoblot in HCT116 and HCT116-C22 cells. HSC70 was used as a loading control. (E) Expression of F4/80, iNOS and Arginase by IHC from tumor sections of mice xenografted with HCT116 or HCT116-C22 (One image representative of six mice in each group, 20x magnification, scale bars 40 μm). (F, G) qPCR analysis of Arginase, iNOS mRNA (F) and TNFa (G) from tumor sections of mice xenografted with HCT116 or HCT116-C22. **p < 0.01, ***p < 0.005.

Figure 2. HSP110 is secreted by CRC cell lines and influences macrophage differentiation profile. (A) Immunoblot analysis of HSP110 in the supernatant of HCT116 and HCT1166-C22 cells. Extracellular HSP90 is used here as a loading control. (B) Differentiating macrophages in the presence of HCT116 or HCT116-C22 supernatants were assessed for the expression of HLA-DR (n = 7), CD163 (n = 5) and CD206 (n = 5) by flow cytometry. Results are expressed as mean fluorescence ratio *p < 0.05; ***p < 0.005; Left, data of all experiments; Right, representative data. (C) Monocytes induced to differentiate in the presence of HCT116 or HCT116-C22 supernatants were stimulated for 24 h with LPS. TNFa (n = 3), IL1b (n = 3), CCL24 (n = 4) and NO (n = 4) secreted by macrophages were determined by Milliplex assay *p < 0.05; **p < 0.01. (D) Percentage of proliferating allogeneic T cells after 3 d of culture with macrophages derived from monocytes in the presence of control DMEN medium or supernatants from HCT116 or HCT116-C22 cells (n = 3), *p < 0.05. (E, F) Monocytes were induced to differentiate into macrophages in the presence of supernatant from HCT116 cells either transfected with a HSP110 siRNA or a scrambled control. Expresssion of CD163 (n = 5), and CD206 (n = 5) was determined by flow cytometry (E). (F) TNFa and IL1b from macrophages derived from monocytes in the presence of supernatants as in E, and stimulated for 24 h with LPS (n = 3) *p < 0.05; **p < 0.01.
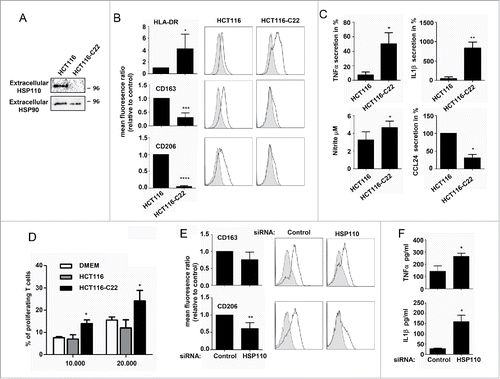
Figure 2. HSP110 is secreted by CRC cell lines and influences macrophage differentiation profile. (A) Immunoblot analysis of HSP110 in the supernatant of HCT116 and HCT1166-C22 cells. Extracellular HSP90 is used here as a loading control. (B) Differentiating macrophages in the presence of HCT116 or HCT116-C22 supernatants were assessed for the expression of HLA-DR (n = 7), CD163 (n = 5) and CD206 (n = 5) by flow cytometry. Results are expressed as mean fluorescence ratio *p < 0.05; ***p < 0.005; Left, data of all experiments; Right, representative data. (C) Monocytes induced to differentiate in the presence of HCT116 or HCT116-C22 supernatants were stimulated for 24 h with LPS. TNFa (n = 3), IL1b (n = 3), CCL24 (n = 4) and NO (n = 4) secreted by macrophages were determined by Milliplex assay *p < 0.05; **p < 0.01. (D) Percentage of proliferating allogeneic T cells after 3 d of culture with macrophages derived from monocytes in the presence of control DMEN medium or supernatants from HCT116 or HCT116-C22 cells (n = 3), *p < 0.05. (E, F) Monocytes were induced to differentiate into macrophages in the presence of supernatant from HCT116 cells either transfected with a HSP110 siRNA or a scrambled control. Expresssion of CD163 (n = 5), and CD206 (n = 5) was determined by flow cytometry (E). (F) TNFa and IL1b from macrophages derived from monocytes in the presence of supernatants as in E, and stimulated for 24 h with LPS (n = 3) *p < 0.05; **p < 0.01.

Figure 3. HSP110DE9 hampers HSP110 release (A) Concentration of extracellular HSP110 in the supernatant of Lovo, HCT116 and SW480 transfected with a control GFP plasmid or a plasmid coding HSP110-GFP and measured by ELISA (n = 3) *p < 0.05 ; **p < 0.01. (B) ELISA quantification of HSP110 in the extracellular medium of SW480 transfected with a control GFP or HSP110DE9-GFP plasmid (n = 3) *p < 0.05. (C) Immunoblot analysis of HSP110 in the supernatant of HCT116, transfected with a HSP110-GFP plasmid with or without a plasmid coding HSP110DE9-GFP. (D) Flow cytometry analysis of HLA-DR (n = 6), CD163 (n = 6) and CD206 (n = 6) expression on macrophages derived from monocytes in the presence of supernatant from SW480 cells transfected with a control GFP, HSP110-GFP or a HSP110DE9-GFP plasmid. Left, data of all experiments; Right, representative data *p < 0.05; **p < 0.01; ***p < 0.001. (E) TNFa, and NO (nitrite) secreted by macrophages derived from monocytes in the presence of SW480 transfected as in C, and stimulated for 24 h with LPS (n = 4, *p < 0.05). (F) Percentage of proliferating allogeneic T cells after 3 d of culture with 104 macrophages derived from monocytes in the presence of supernatant from SW480 transfected with a control GFP or a HSP110DE9-GFP (n = 3). *p < 0.05.
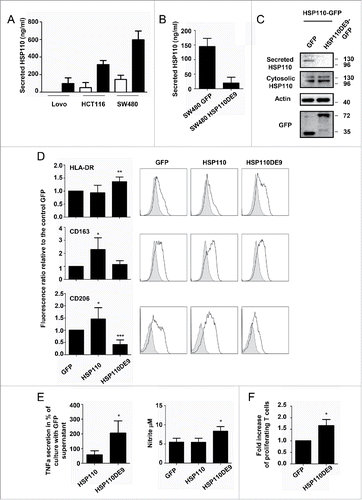
Figure 3. HSP110DE9 hampers HSP110 release (A) Concentration of extracellular HSP110 in the supernatant of Lovo, HCT116 and SW480 transfected with a control GFP plasmid or a plasmid coding HSP110-GFP and measured by ELISA (n = 3) *p < 0.05 ; **p < 0.01. (B) ELISA quantification of HSP110 in the extracellular medium of SW480 transfected with a control GFP or HSP110DE9-GFP plasmid (n = 3) *p < 0.05. (C) Immunoblot analysis of HSP110 in the supernatant of HCT116, transfected with a HSP110-GFP plasmid with or without a plasmid coding HSP110DE9-GFP. (D) Flow cytometry analysis of HLA-DR (n = 6), CD163 (n = 6) and CD206 (n = 6) expression on macrophages derived from monocytes in the presence of supernatant from SW480 cells transfected with a control GFP, HSP110-GFP or a HSP110DE9-GFP plasmid. Left, data of all experiments; Right, representative data *p < 0.05; **p < 0.01; ***p < 0.001. (E) TNFa, and NO (nitrite) secreted by macrophages derived from monocytes in the presence of SW480 transfected as in C, and stimulated for 24 h with LPS (n = 4, *p < 0.05). (F) Percentage of proliferating allogeneic T cells after 3 d of culture with 104 macrophages derived from monocytes in the presence of supernatant from SW480 transfected with a control GFP or a HSP110DE9-GFP (n = 3). *p < 0.05.

Figure 4. Depletion of HSP110 from the supernatants skews the pro-inflammatory phenotype of macrophages. (A) Immunoblot analysis of HSP110 from the immunoprecipitated (IP) fraction of HCT116 supernatant (one image representative of (3). (B) ELISA determination of HSP110 amount in the supernatant of SW480 or HCT116 before (black columns) and after (white columns) HSP110 immunoprecipitation. (C), Expresssion of HLA-DR (n = 5), CD163 (n = 5) and CD206 (n = 4) by flow cytometry on macrophages derived from monocytes in the presence of HSP110-depleted HCT116 supernatant. Left, data of all experiments; Right, representative data *p < 0.05; **p < 0.01. (D) TNFa, and IL1b secreted by macrophages derived from monocytes in the presence of HSP110-depleted HCT116 supernatant, and stimulated for 24 h with LPS (n = 4) *p < 0.05.
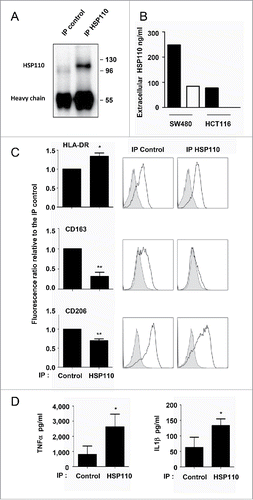
Figure 4. Depletion of HSP110 from the supernatants skews the pro-inflammatory phenotype of macrophages. (A) Immunoblot analysis of HSP110 from the immunoprecipitated (IP) fraction of HCT116 supernatant (one image representative of (3). (B) ELISA determination of HSP110 amount in the supernatant of SW480 or HCT116 before (black columns) and after (white columns) HSP110 immunoprecipitation. (C), Expresssion of HLA-DR (n = 5), CD163 (n = 5) and CD206 (n = 4) by flow cytometry on macrophages derived from monocytes in the presence of HSP110-depleted HCT116 supernatant. Left, data of all experiments; Right, representative data *p < 0.05; **p < 0.01. (D) TNFa, and IL1b secreted by macrophages derived from monocytes in the presence of HSP110-depleted HCT116 supernatant, and stimulated for 24 h with LPS (n = 4) *p < 0.05.

Figure 5. Extracellular effect of HSP110 on macrophage profile involves TLR4. (A) The percentage of HSP110-induced CD206-expressing differentiated macrophages in the presence or absence of SRA, TLR2 and/or TLR4 neutralizing antibodies was determined by flow cytometry. Data are expressed as a percentage of the control (no neutralizing Ab added)(n = 6, *p < 0.05.). (B) Fluorescence microscopy analysis of TLR4 and DDK(FLAG)-tagged HSP110 purified from eukaryotic cells (LPS free) on monocytes after 30 min of incubation with HSP110. One representative image is shown. Scale bars 10 μm. (C) TLR4 gene reporter assay (luciferase) using control HSP110-depleted supernatant, supernatant from HSP110-overexpressing HCT116 cells or a similar amount (600 ng/mL) of purified recombinant LPS-free HSP110 (n = 2). *p < 0.05.
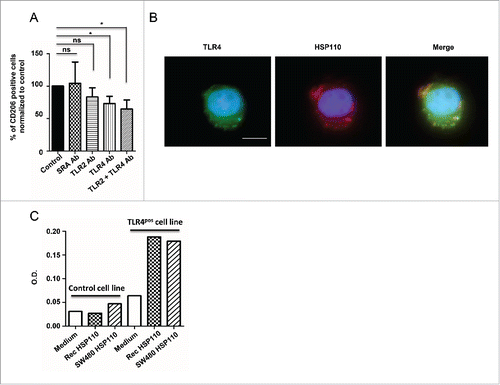
Figure 5. Extracellular effect of HSP110 on macrophage profile involves TLR4. (A) The percentage of HSP110-induced CD206-expressing differentiated macrophages in the presence or absence of SRA, TLR2 and/or TLR4 neutralizing antibodies was determined by flow cytometry. Data are expressed as a percentage of the control (no neutralizing Ab added)(n = 6, *p < 0.05.). (B) Fluorescence microscopy analysis of TLR4 and DDK(FLAG)-tagged HSP110 purified from eukaryotic cells (LPS free) on monocytes after 30 min of incubation with HSP110. One representative image is shown. Scale bars 10 μm. (C) TLR4 gene reporter assay (luciferase) using control HSP110-depleted supernatant, supernatant from HSP110-overexpressing HCT116 cells or a similar amount (600 ng/mL) of purified recombinant LPS-free HSP110 (n = 2). *p < 0.05.
Supplemental material

KONI_A_1170264_supplementary_material.zip

Download Zip (775.2 KB)

Reprints and Corporate Permissions

Please note: Selecting permissions does not provide access to the full text of the article, please see our help page How do I view content?

To request a reprint or corporate permissions for this article, please click on the relevant link below:

Academic Permissions

Please note: Selecting permissions does not provide access to the full text of the article, please see our help page How do I view content?

Obtain permissions instantly via Rightslink by clicking on the button below:

If you are unable to obtain permissions via Rightslink, please complete and submit this Permissions form. For more information, please visit our Permissions help page.