Figures & data
Figure 1. The amount of M2 macrophages is correlated with HA expression in human breast malignant tissues. (A) Immunohistochemical analysis showing HE staining, HA content, CD204+ macrophages, and CD206+ macrophages in human breast benign and malignant tissues. Shown are representative images from 40 patients with breast benign diseases and 42 breast cancer patients. (B–D) Scatter plots showing levels of HA (B), CD204+ macrophages (C), and CD206+ macrophages (D) in tissue samples of patients with breast cancer (n = 42) and benign diseases (n = 40). ***p < 0.001 by Student's t-test. (E, F) Scatter plots showing the positive correlation between HA expression and the number of CD204+/CD206+macrophages in tissue samples of breast cancer patients (n = 42). Pearsons' coefficient tests were performed to assess statistical significance.
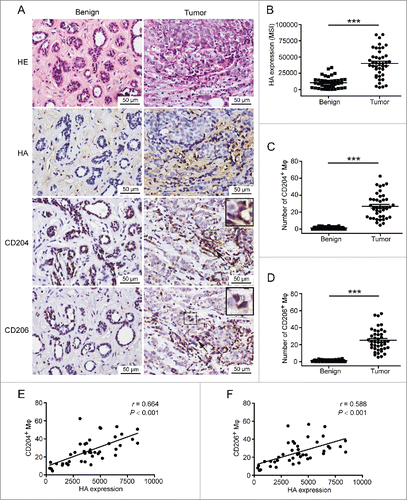
Table 1. Clinicopathologic characteristics of study population in relation to HA expression, CD204+ macrophages, and CD206+ macrophages.
Figure 2. Inducement of M2-like macrophages by breast cancer cell lines with different HA expression levels. (A) Flow cytometry analysis showing expression levels of CD14, CD204, and CD206 in THP-1 cells and monocytes. (B) Western blot analysis of STAT3 phosphorylation levels of THP-1 cells and monocytes. (C, D) Levels of IL-10 and TGF-β secreted by monocytes were measured by ELISA assay. (E) Apoptosis of BT-549 cells induced by monocytes. (a) BT-549 cells cultured in normal condition; (b) BT-549 cells co-cultured with monocytes which were cultured in normal medium for 72 h; (c) BT-549 cells co-cultured with monocytes which were pretreated with 50% BT-549 supernatant for 72 h. The ratio of apoptotic BT-549 cells was determined by manually counting white condensed pyknotic nuclei (white arrows point to the representative apoptotic nuclei of BT-549 cells, and red arrows point to the nuclei of monocytes). At least five fields were counted for each experimental group. Data represented are shown as mean ± s.d. from three independent experiments. *p < 0.05, **p < 0.01, ***p < 0.001 (* VS Control); #p < 0.05, ##p < 0.01, ###p < 0.001 (# VS BT-549 or BT-549S).
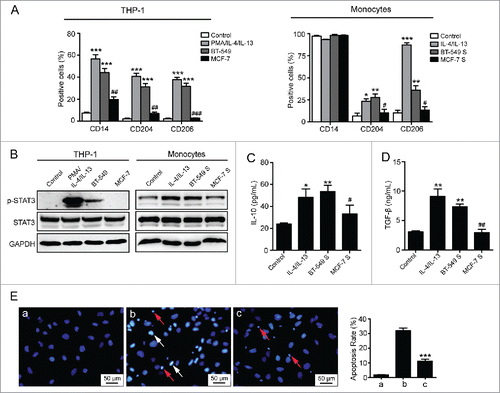
Figure 3. 4-MU inhibits the formation of M2 macrophages by suppressing HA synthesis. (A) Flow cytometry analysis showing expression levels of CD14, CD204, and CD206 in THP-1 cells and monocytes. (B) Western blot analysis of STAT3 phosphorylation levels of THP-1 cells and monocytes. (C, D) Levels of IL-10 and TGF-β secreted by monocytes were measured by ELISA assay. (E) Apoptosis of BT-549 cells induced by monocytes. (a) BT-549 cells co-cultured with monocytes which were treated with 50% BT-549 supernatant for 72 h. (b) BT-549 cells co-cultured with monocytes which were cultured in 50% supernatant of 4-MU treated BT-549 cells for 72 h. All data represented are shown as mean ± s.d. from three independent experiments. *p < 0.05, **p < 0.01, ***p < 0.001 (* VS BT-549 or BT-549S).
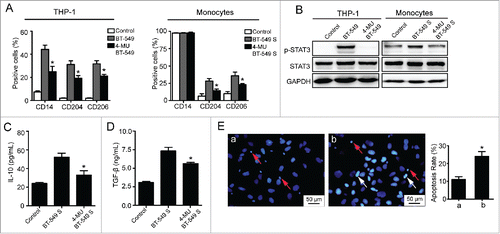
Figure 4. Over-expression of HA promotes M2 macrophages formation. (A) Flow cytometry analysis showing expression levels of CD14, CD204, and CD206 in THP-1 cells and monocytes. (B) Western blot analysis of STAT3 phosphorylation levels of THP-1 cells and monocytes. (C, D) Levels of IL-10 and TGF-β secreted by monocytes were measured by ELISA assay. Graphs represent the mean ± s.d. from three independent experiments. *p < 0.05, **p < 0.01, ***p < 0.001 (* VS MCF-7mock or MCF-7mock S).
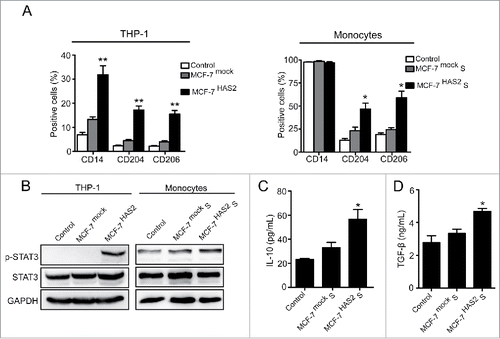
Figure 5. HA over-expressed breast cancer cells induce M2 macrophages formation in vivo. (A) Immunohistochemical analysis showing HE staining, HA expression, CD204+ macrophages, and CD206+ macrophages in tissue samples of mouse breast tumors formed by MCF-7mock cells or MCF-7HAS2 cells. (B–D) Box plots showing levels of HA, CD204+ macrophages, and CD206+ macrophages in tissue samples of tumors formed by MCF-7mock cells (n = 3) and MCF-7HAS2 cells (n = 3). Data represented are shown as mean ± s.d..*p < 0.05, **p < 0.01.
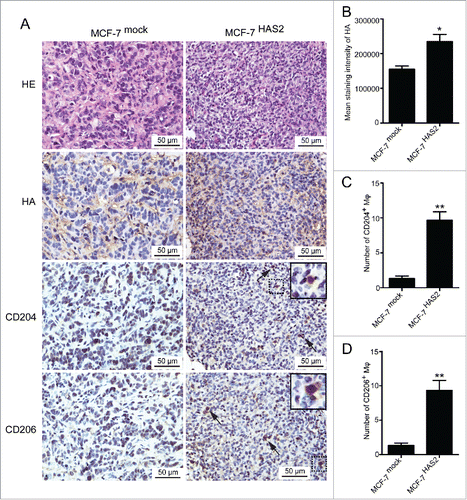
Figure 6. Involvement of HA–CD44 interaction in the formation of M2 macrophages. (A) Flow cytometry analysis showing expression levels of CD14, CD204, and CD206 in THP-1 cells and monocytes. (B) Western blot analysis of STAT3 phosphorylation levels of THP-1 cells and monocytes. (C, D) Levels of IL-10 and TGF-β secreted by monocytes were measured by ELISA assay. Graphs represent the mean ± s.d. from three independent experiments. (E) Apoptosis of BT-549 cells induced by monocytes. (a) BT-549 cells co-cultured with monocytes which were pretreated with non-immune IgG (10 µg/mL) and cultured in 50% BT-549 supernatant for 72 h. (b) BT-549 cells co-cultured with monocytes which were pretreated with anti-CD44 mAb (10 µg/mL) and cultured in 50% BT-549 supernatant for 72 h. The data represented are shown as mean ± s.d. from three independent experiments. *p <0.05 (* VS BT-549+IgG or BT-549S+IgG).
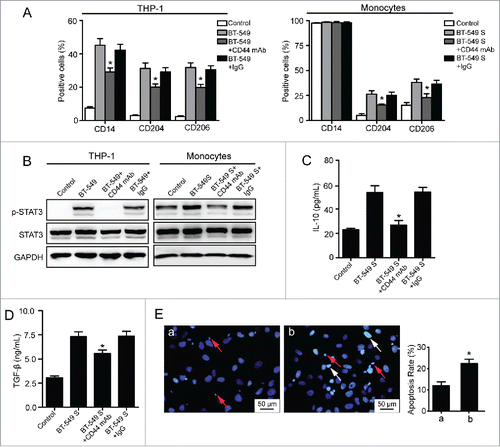
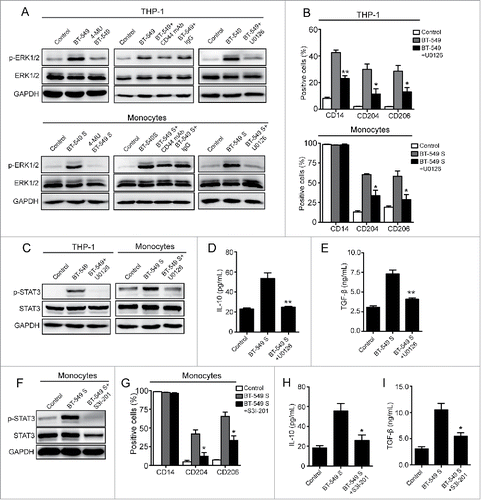
Figure 7. ERK1/2-STAT3 pathway is involved in M2 macrophages formation. (A) Western blot analysis of ERK1/2 phosphorylation levels of THP-1 cells and monocytes. (B, G) Flow cytometry analysis showing expression levels of CD14, CD204, and CD206 in THP-1 cells and monocytes. (C, F) Western blot analysis of STAT3 phosphorylation levels of THP-1 cells and monocytes. (D, E, H, I) Levels of IL-10 and TGF-β secreted by monocytes were measured by ELISA assay. The data represented are shown as mean ± s.d. collected from three independent experiments. Student's t-tests were performed to assess statistical significance.*p < 0.05, **p < 0.01, ***p < 0.001 (* VS BT-549 or BT-549S).