Figures & data
Figure 1. ES specificity of STEAP1130-specific T cell line P2A5. (A) Multimer staining of STEAP1130-P2A5 with CD8-APC and specific HLA-A*02:01/STEAP1130 multimer (bottom) or irrelevant multimer as control (top) (B–D), IFNγ release of STEAP1130-P2A5 during co-culture with STEAP1130 and influenza-pulsed T2 cells, respectively. (B) HLA-A*02:01+ (A673, TC71) and HLA-A*02:01− (SB-KMS-KS1, SK-N-MC, K562) tumor cells expressing STEAP1 or lacking STEAP1 expression (MHH-NB11). (C) TC-71 cells with and without MHC-I specific blocking mAB W6.32. (D) A673 cells with and without STEAP1 knock down. (E) T2 cells pulsed with titrated amounts of STEAP1130 peptide. (F) Cos 7 cells transfected with HLA-A*02:01 and either STEAP1 or GFP. (G) All analyzed in triplicates via IFNγ ELISpot. Error bars indicate SEM. p values < 0.05 were considered as statistically significant (*p < 0.05; **p < 0.005; ***p < 0.0005).
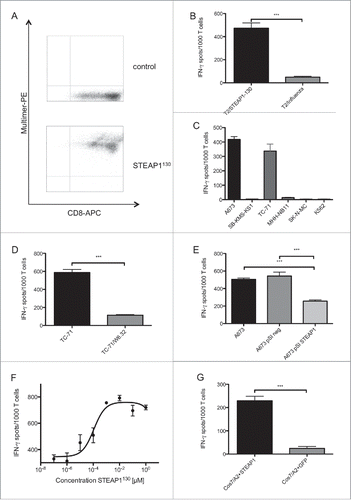
Figure 2. Antitumor reactivity of STEAP1130-specific T cell clone P2A5. (A) Effector:target ratio- (E/T) dependent granzyme B release of STEAP1130-P2A5 after co-culture with various tumor cell lines. (B) Target-specific tumor cell lysis of A673 and SK-N-MC (E/T: 10) by STEAP1130-P2A5, detected via xCELLigence assay. (C) E/T-dependent timeframe needed for killing of 50% of tumor cells (kt50) by STEAP1130-P2A5.
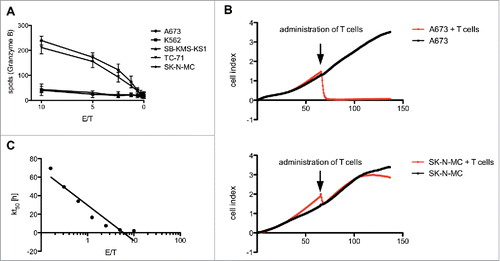
Figure 3. Generation of STEAP1130 TCR-transgenic TSCM. (A) Identification of TCR α- (TRAV) and β- (TRBV) chains via PCR. Additionally, a scheme of the TCR construct, containing either minimal murinized and codon optimized (humm) or wild type (wt) TCR α- and β-chains linked with a self-cleaving P2A element and integrated into the pMP-71 vector is shown. (B) Multimer staining of STEAP1130 TCR-transgenic T cells with CD8-APC and HLA-A*02:01/STEAP1130 multimer (bottom) or irrelevant multimer as control (top). (C) Dot plots of T cells, co-stained with CCR7-PE/CD95-APC, CD45R0-PE/CD62L-APC and histogram plot of CD45RA-PE stained CD8+ T cells.
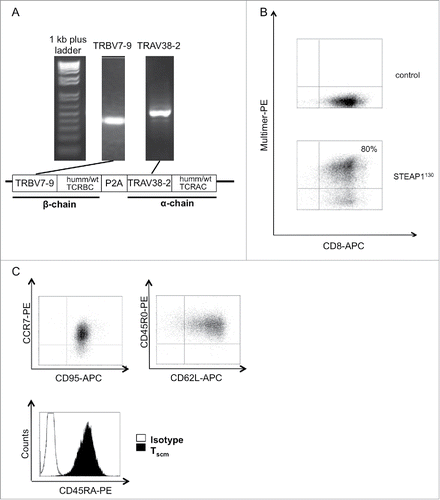
Figure 4. Antigen specificity of STEAP1130 TCR-transgenic CD8+ T cells. (A–C) IFNγ release of STEAP1P2A5 TCR-transgenic T cells during co-culture with STEAP1130- and influenza-pulsed T2 cells, respectively. (A) HLA-A*02:01+ (A673, TC71) and HLA-A*02:01− (SB-KMS-KS1, SK-N-MC, K562) tumor cells expressing STEAP1. (B) T2 cells pulsed with titrated amounts of STEAP1130 peptide. (C) All analyzed in triplicates via IFNγ ELISpot. Error bars indicate SEM. p values < 0.05 were considered as statistically significant (***p < 0.0005). (D) Target-specific tumor cell lysis of A673 and SK-N-MC (E/T: 10) by STEAP1130 TCR-transgenic T cells, detected via xCELLigence assay. (E) T cell dose-dependent lysis of A673 cells after STEAP1 knock down (A673pSiSTEAP1, see supplementary information) in comparison to control transfected A673 cells (A673pSineg), 2 h after T cell inoculation. (F) IFNγ release of STEAP1P2A5 TCR-transgenic T cells upon co-culture with STEAP1130 peptide-loaded or unloaded, respectively, LCL cell lines in the context of various HLA-A subtypes.
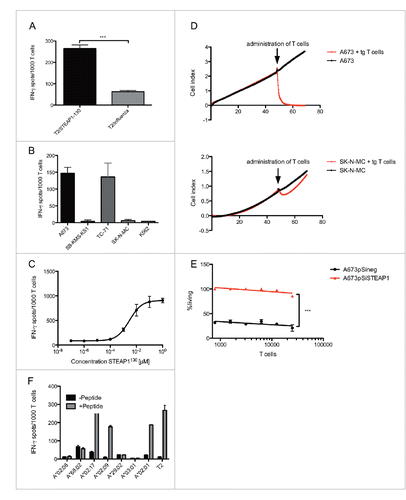
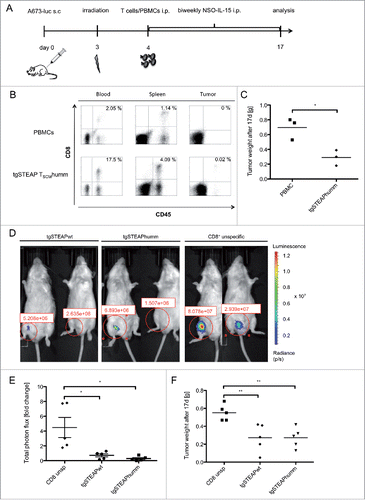
Figure 5. In vivo anti ES reactivity of STEAP1130TCR-transgenic TSCM. 2 × 10⁶ A673 cells were injected into the groin of Rag2−/−γc−/− mice. Animals were irradiated on day 3 (3.5 Gy) and received 5 × 10⁶ T cells the day after. 1.5 × 10⁷ human IL-15 producing cells were injected twice a week i.p. (A) Scheme of the experimental set-up for in vivo experiments. (B–C) Animals treated with either human codon optimized/minimal murinized (humm) STEAP1P2A5 TCR-transgenic (tg) T cells or unspecific PBMCs were analyzed 17 d after inoculation with A673 cells. (B) FACS analysis of blood, spleen and tumor of animals. Whole blood was stained with anti-human CD45 mAb and anti-human CD8 mAb. Percentages of double positive cells are given. A representative experiment of three mice per group is shown. (C) Analysis of total tumor weight, each dot corresponds to one animal. (D–F) Animals received 2 × 16 luciferase expressing A673 cells and were irradiated on day 3 (3.5 Gy). One day later, 5 × 10⁶ STEAP1P2A5 TCR-transgenic TSCM were injected i.p. (D) Total photon flux (p/s) of luciferase expressing A673 cells, 3 d after i.p injection of either wild type (wt) or humm STEAP1-transgenic TSCM or unspecific CD8+ T cells, respectively. (E) Fold change of total photon flux 3 d after i.p injection of either wt or humm STEAP1-transgenic TSCM or unspecific CD8+ T cells, respectively. (F) Absolute tumor weight of tgSTEAP1wt- or tgSTEAP1humm-treated animals and unspecific CD8+ T-cell-treated controls, 17 d after initial tumor cell injection. Each dot corresponds to one animal.