Figures & data
Figure 1. Kaplan–Meier curves of differences in survival among patients with hepatocellular carcinoma (HCC) who received adjuvant CIK cell treatment (CIK treatment group) or hepatectomy alone (surgery alone group). (A) Overall survival (OS) and (B) recurrence-free survival (RFS) curves. Significantly improved OS and PFS were observed in the CIK treatment group versus the surgery alone group.
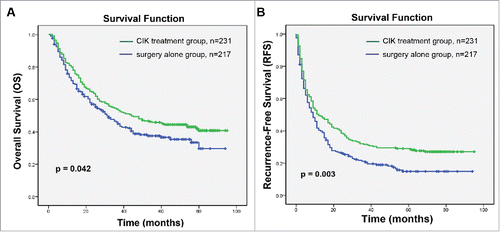
Table 1. Demographics and clinical characteristics of patients in the CIK treatment and surgery alone groups.
Figure 2. Immunohistochemical analysis of PD-L1 expression in primary hepatocellular carcinoma surgical specimens. Positive staining results are reported as the percentage of tumor cells showing membranous PD-L1 expression (frequency). (A and D) PD-L1 expression was scored as <1%, (B and E) PD-L1 expression was scored as 1–5%, (C and F) PD-L1 expression was scored as ≥5%. PD-L1 staining is indicated by the presence of brown chromogen. Blue represents the hematoxylin counterstain (A–C, 100× magnification; D–F, 400× magnification).
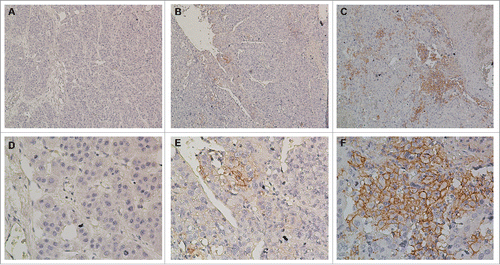
Figure 3. Correlation of PD-L1 expression by HCC cells with the survival benefit from adjuvant CIK cell immunotherapy. Differences in levels of PD-L1 expression between patients showing a long-term versus a minimal survival benefit are shown before (A) and after (B) the propensity score weighting method was used to balance all covariates. C and D depicts the Kaplan–Meier curves for overall survival (OS) and recurrence-free survival (RFS) in the CIK cell treatment group for patients with ≥5%, 1–5% and <1 % PD-L1 expression, respectively.
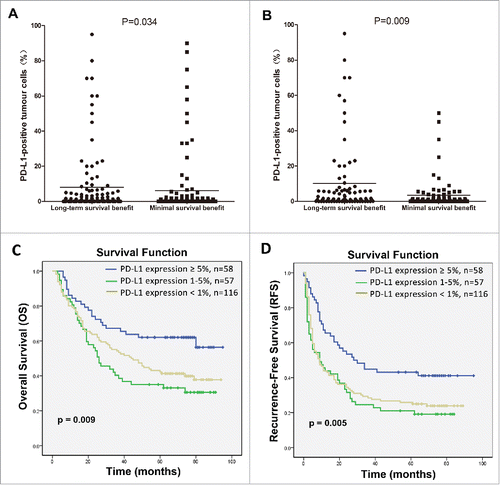
Table 2. Demographics and clinical characteristics of patients according to the survival benefit from CIK cell therapy before and after use of PS weighting.
Table 3. Univariate and multivariate analysis of overall survival (OS) in HCC patients who received adjuvant CIK cell immunotherapy.
Table 4. Univariate and multivariate analysis of recurrence-free survival (RFS) in HCC patients who received adjuvant CIK cell immunotherapy.
Figure 4. Kaplan–Meier curves for HCC patients who received hepatectomy alone based on expression of PD-L1 on tumor cells. (A) Overall survival (OS) and (B) recurrence-free survival (RFS) curves are shown. No correlation with PD-L1 expression was observed with the OS of RFS rates of patients with HCC; p values were calculated using the log-rank test.
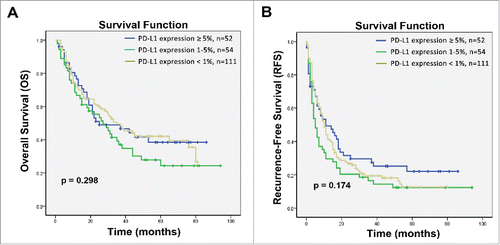
Figure 5. Subgroup analysis to estimate the impact of PD-L1 expression on survival benefits of additional CIK treatment according to hepatitis B viral load. (A) OS and RFS curves for patients with high hepatitis B viral load. (B) OS and RFS curves for patients with low hepatitis B viral load.
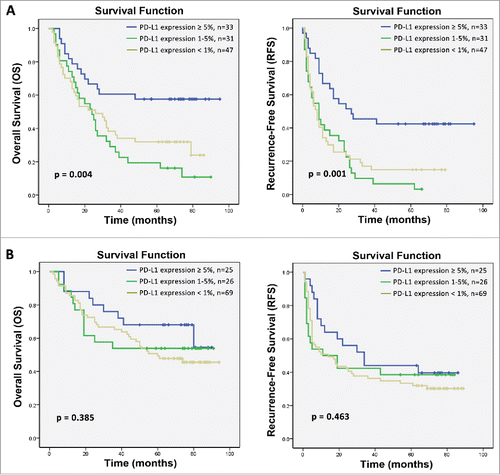
Table 5. Correlation of PD-L1 expression and immunological status to HBV.
Figure 6. Association between PD-L1 expression on tumor cells and infiltration of inflammatory cells in HCC microenvironment. (A) Gating routine for the identification of tumor cells and CD45+ cells is shown. Flow cytometric analysis was performed to measure PD-L1 expression on tumor cells(gate C) and CD4+, CD8+, CD56+, and CD68+ cell subsets gating on the CD45+fraction(gate B). Significantly higher percentages of CD4+ T cells and CD8+ T cells were observed in the HCC tumor tissues with high PD-L1 expression (case 1) compared to that with low PD-L1 expression (case 2). (B) A summary of correlation analysis was shown that PD-L1 positive tumor cells in tumor tissues significantly correlated with tumor-infiltrating CD4+ and CD8+ T cells, but not associated with CD56+ NK cell and CD68+ macrophage (n = 10).
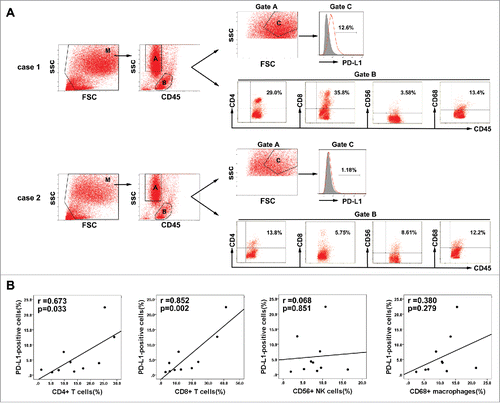
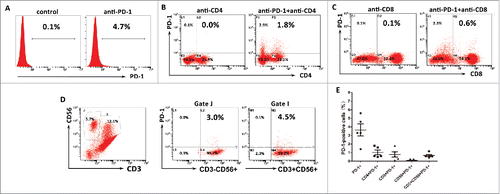
Figure 7. PD-1 expression on the autologous CIK cells. (A) The percentages of PD-1 positive cells among the populations of CIK cells. (B) The percentages of CD4+PD-1+ CIK cells. (C) The percentages of CD8+PD-1+ CIK cells. (D) The percentages of CD3−CD56+ PD-1+ and CD3+CD56+ PD-1+ CIK cells. (E) PD-1 expression on each subgroup of CIK cells in five HCC patients. These data suggested CIK cells exhibited a low PD-1 expression.