Figures & data
Figure 1. The immune system is involved in the IFNγ dependent antitumor activity of active or heat-inactivated arazyme. (A) C57BL/6 male mice (n = 6 or 7), and (B) C57BL/6 (WT, n = 5), NSG (n = 5), iNOS−/− (n = 5), and IFNγ−/− (n = 3) mice were inoculated intravenously with 5 × 10⁵ B16F10-Nex2 melanoma cells and then treated intraperitoneally with 3 mg/kg of active or heat-inactivated arazyme for 2 weeks on alternate days. The melanotic pulmonary nodules were counted 15 d after tumor cell inoculation. Individual animals are represented, and the average ± SD is shown by central horizontal and vertical lines, respectively. Control, untreated mice. Each experiment was repeated at least twice. ****p < 0.0001, analyzed by one-way ANOVA with Tukey's multiple comparisons.
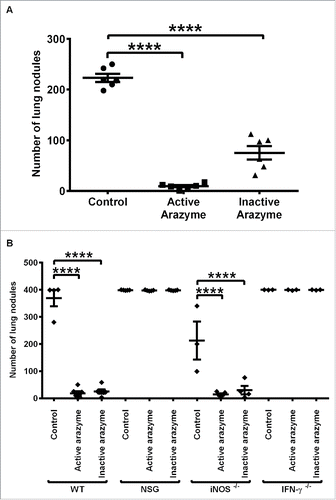
Figure 2. CD4+/CD8+-dependent antitumor response and increased production of pro-inflammatory cytokines are induced by active/inactive arazyme treatment. C57Bl/6 mice (n = 6) were challenged endovenously with 5 × 10⁵ B16F10-Nex2 cells and treated intraperitoneally with 3 mg/kg of active/inactive arazyme or PBS (Control) on alternate days for 2 weeks. Spleens were collected 24 h after the last dose, splenocytes were stimulated ex vivo with B16F10-Nex2 tumor lysate, and intracellular cytokine staining (ICCS) was then performed for CD4+ and CD8+ positive T cells. (A) The percentage of splenic IFNγ- or IL10-producing CD4+ or CD8+ T cells was determined by FACS, and is represented by the numbers in the upper right quadrants. Histograms represent six pooled animals. (B) C57BL/6 mice were depleted of CD4+ or CD8+ T lymphocytes by two doses (500 μg each) of specific monoclonal antibodies 72 and 48 h before challenge with tumor cells and treatment with active/inactive arazyme. Animals were sacrificed 24 h after the last dose, and the number of lung nodules is represented individually. (C) IFNγ, (D) TNF-α, and (E) IL-10 were quantified in lung homogenates, (F) IL-12 was quantified in culture supernatant of splenocytes stimulated with tumor lysate, and (G) IFNγ was quantified in 1:2 diluted serum from C57Bl/6 mice challenged and treated as described above. Cytokines were quantified in individual animals, and bars represent the average ± SD of at least three animals. *p < 0.05; ***p < 0.001; and ****p < 0.0001, analyzed by one-way ANOVA with Tukey's multiple comparisons (in B) and one-way ANOVA with Dunnett's multiple comparisons (in C–G).
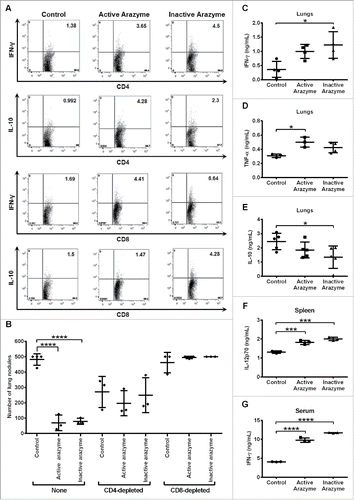
Figure 3. Dendritic cell (DC) activation by active or inactive arazyme. GM-CSF-treated bone marrow-derived DCs (BMDCs) from C57BL/6 mice were incubated in V bottom plates (1 × 10⁵ cells) with lipopolysaccharide (LPS) (200 ng/mL in A, C–F, or indicated concentrations in D) and/or indicated concentrations of active or heat-inactivated arazyme for 24 h. IL-12p70 was quantified in culture supernatants by ELISA (A) and (D) and the expression of CD80 (B) and CD86 (C) was analyzed by FACS in gated CD11c-MHC-II positive cells. The same experiment was performed with BMDCs obtained from BALB/c mice: IL-12p70 (E) and IL-6 (F) were quantified in culture supernatant by ELISA. *p < 0.05; **p < 0.01; ***p < 0.001; and ****p < 0.0001, analyzed by one-way ANOVA with Tukey's multiple comparisons (in A and B) and one-way ANOVA with Dunnett's multiple comparisons (in C–F).
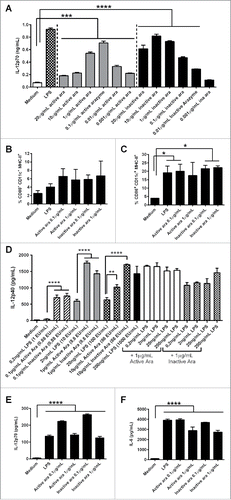
Figure 4. Myd88 and TRIF pathways are involved in the activation of dendritic cells by active and inactive arazyme. GM-CSF-treated bone marrow-derived dendritic cells (BMDCs) from C57BL/6 (white bars) or double MyD88−/−/TRIF−/− knockout (black bars) mice were incubated in V bottom plates (1 × 10⁵ cells/well) for stimulation with indicated concentrations of active or heat-inactivated arazyme, lipopolysaccharide (LPS), Curdlan (CDL), or CPG for 24 h. IL-12p70, IL-1α, TNF-α, IL-1β, IL-6, and IL-10 (A) and NO (B) were quantified in the culture supernatants using the cytometric bead array (CBA) and the Griess method, respectively. (C) CD11c+-enriched splenocytes from either C57BL/6 (white bars) or MyD88−/−/TRIF−/− (black bars) mice were incubated in V bottom plates (1 × 10⁵ cells/well) for stimulation with indicated concentrations of active or heat-inactivated arazyme, LPS, CDL, or CPG for 24 h. IFNγ, IL-1α, IL-6, IL-1β, TNF-α, and IL-10 were quantified in the culture supernatants using CBA. Results represent data from triplicate samples of three (C57BL/6) or two (MyD88−/−/TRIF−/−) individually analyzed mice. Media, unstimulated control.
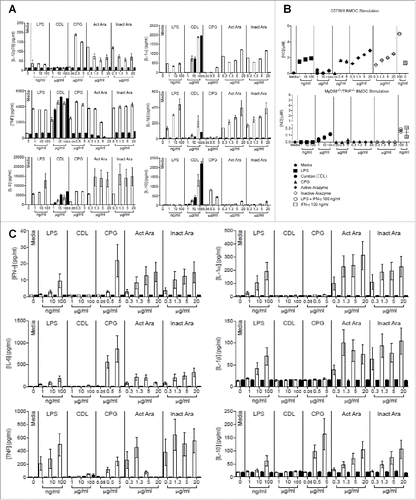
Figure 5. Active and inactive arazyme activates bone marrow-derived dendritic cells (BMDCs) via the TLR-4/Myd88/TRIF/ pathway. (A) GM-CSF-treated BMDCs from C57BL/6, MyD88−/−, or TRIF−/− mice were stimulated for 24 h in V bottom plates (1 × 10⁵ cells/well) with lipopolysaccharide (LPS) (200 ng/mL) or indicated concentrations of active and heat-inactivated arazyme. (B) GM-CSF-derived BMDCs from C57BL/6 mice were incubated as described in (A) and stimulated with LPS (200 ng/mL), IFNγ (100 U/mL), LPS + IFNγ, or indicated concentrations of active and heat-inactivated arazyme, in the presence or absence (Control) of 1 μM CLI-095, a TLR-4 inhibitor. (C) GM-CSF-derived BMDCs from C57BL/6 or TLR-4−/− mice were incubated and stimulated as described in (B). The nitric oxide (NO) released in the supernatant was quantified using the Griess assay in (A), (B), and (C). **p < 0.01 and ****p < 0.0001, analyzed by one-way ANOVA with Dunnett's multiple comparisons.
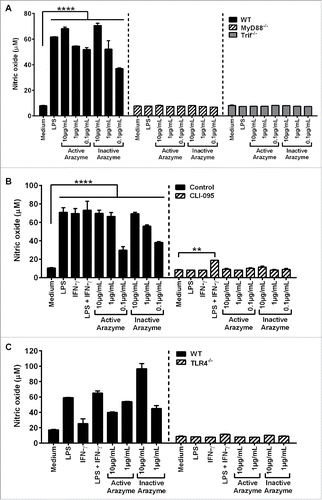
Figure 6. Other signaling pathways are also involved in active or inactive arazyme activation of GM-CSF-derived bone marrow-derived dendritic cells (BMDCs). (A) BMDCs were obtained from C57BL/6 mice, incubated in V bottom plates (1 × 10⁵ cells/well), pretreated for 1 h with SP600125 (JNK inhibitor, 50 µM), SB203580 (P38 inhibitor, 20 µM) or PD98059 (MAPK/ERK inhibitor, 100 µM) and stimulated with lipopolysaccharide (LPS) (200 ng/mL) or with indicated concentrations of active or heat-inactivated arazyme for 48 h. IL-12 was quantified in culture supernatants by ELISA. (B) BMDCs were treated for 2 h with LPS (200 ng/mL) or heat-inactivated arazyme (10 μg/mL) and the levels of p-STAT1, p-STAT5, p-JNK, p-MAPK/ERK, P38, and p-P38 in cell lysates were analyzed by western blotting. (C) Densitometric quantification of bands in (B). Medium, unstimulated cells; Control, stimulated BMDCs in the absence of inhibitors. **p < 0.01 and ****p < 0.0001, analyzed by one-way ANOVA with Dunnett's multiple comparisons.
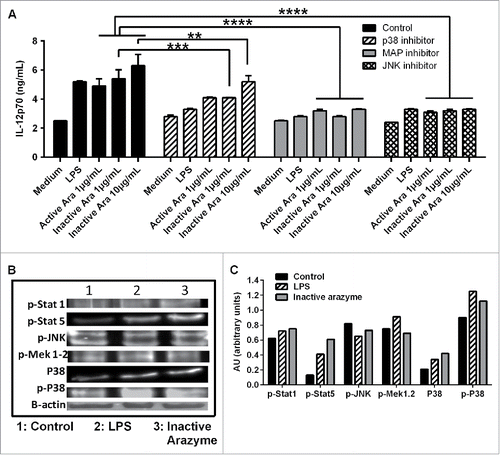
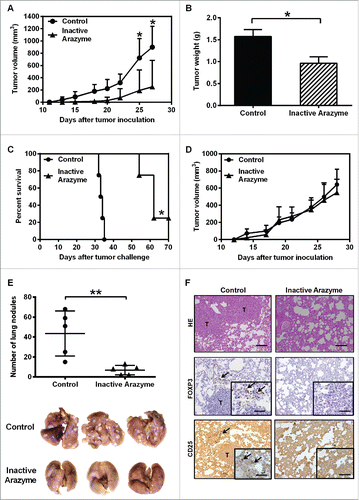
Figure 7. Treatment with inactivated arazyme had protective effects in a 4T1 breast adenocarcinoma preclinical model and requires a competent immune system. (A) Female BALB/c mice (five per group) were inoculated into the mammary fat pad with 104 viable 4T1 murine mammary adenocarcinoma cells. Starting on the 1st day after tumor cell inoculation, heat-inactivated arazyme (1 mg/Kg) or PBS (Control) was inoculated intraperitoneally every other day for 4 weeks. The average ± SD of primary tumor volumes are shown. (B) NSG mice (n = 5) were challenged and treated as described in (A) and primary tumor volumes were measured. (C) Survival plot of BALB/c mice depicted in (A). (D) Primary tumor weights, collected on day 30 from BALB/c mice depicted in (A). (E) Metastatic lung nodules of animals were counted 30 d after tumor cell inoculation, using an inverted microscope. Representative images of each group are shown. (F) Lungs from BALB/c mice were collected after 30 d and tissue sections were stained with hematoxylin/eosin (HE) to show metastasis development, and immunostained with monoclonal anti-CD25 or anti-Foxp3 antibodies. Tissues were visualized microscopically, ×200 magnification. Black bars = 100 μm. T, tumor areas; arrows, immunostained areas. *p < 0.05 and **p < 0.01, analyzed using the unpaired Student's t test (in A, B, D, and E) and the Log-Rank test (in C).