1,957
Views
44
CrossRef citations to date
0
Altmetric
Original Research

Programmed death ligand 1 as an indicator of pre-existing adaptive immune responses in human hepatocellular carcinoma

, , , , , , , , & show all
Article: e1181252 | Received 03 Feb 2016, Accepted 15 Apr 2016, Published online: 30 Jun 2016

Figures & data

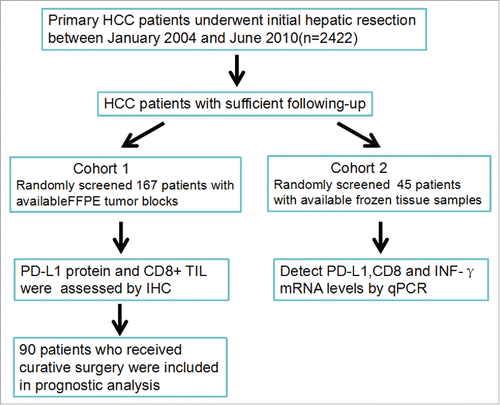
Figure 1. Study design.

Figure 1. Study design.

Table 1. Patients Clinicopathological features.

Figure 2. PD-L1 expression pattern in FFPE samples stained with anti-PD-L1 antibody. (A) Placenta was used as a positive control for PD-L1 expression. (B) Isotype control. (C) Samples displaying pattern 1 exhibited negative expression in HCC cells. Original magnification, ×200. (D) Samples exhibiting pattern 2 displayed focal staining, original magnification, ×200. (E) Original magnification of the boxed area shown in (D), ×400 (F) Samples displaying pattern 3 exhibited diffuse PD-L1 expression (> 40% tumor PD-L1). Original magnification, ×200.
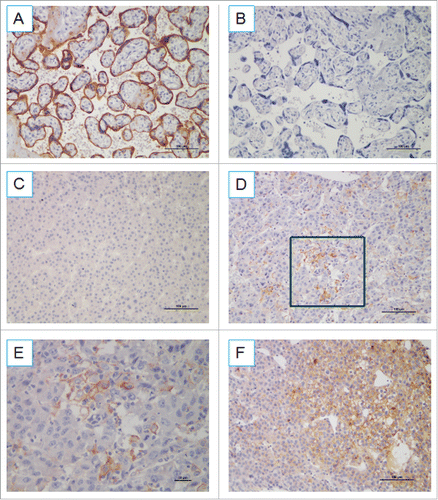
Figure 2. PD-L1 expression pattern in FFPE samples stained with anti-PD-L1 antibody. (A) Placenta was used as a positive control for PD-L1 expression. (B) Isotype control. (C) Samples displaying pattern 1 exhibited negative expression in HCC cells. Original magnification, ×200. (D) Samples exhibiting pattern 2 displayed focal staining, original magnification, ×200. (E) Original magnification of the boxed area shown in (D), ×400 (F) Samples displaying pattern 3 exhibited diffuse PD-L1 expression (> 40% tumor PD-L1). Original magnification, ×200.

Table 2. Association of PD-L1 expression and clinicopathological features of HCC patients.

Figure 3. Immunohistochemical staining of human HCC tissues using anti-PD-L1 and CD8+ Abs. (A) FFPE tissue sections were analyzed by IHC for PD-L1 expression on tumor cells and CD8+ cell infiltration. PD-L1 positivity was defined as ≥ 5%, and the number of CD8+ cells was assessed in five distinct microscopic field (×200). (B) Tumors were classified as PD-L1+ and PD-L1 and analyzed for the amount of CD8+.

Figure 3. Immunohistochemical staining of human HCC tissues using anti-PD-L1 and CD8+ Abs. (A) FFPE tissue sections were analyzed by IHC for PD-L1 expression on tumor cells and CD8+ cell infiltration. PD-L1 positivity was defined as ≥ 5%, and the number of CD8+ cells was assessed in five distinct microscopic field (×200). (B) Tumors were classified as PD-L1+ and PD-L1− and analyzed for the amount of CD8+.
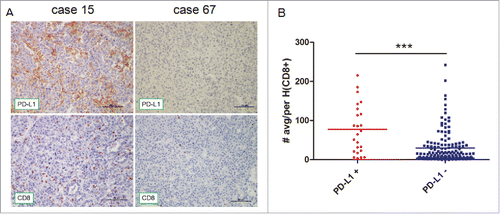
Figure 4. Correlation among the relative expression of PD-L1, CD8+, and INFγ, in tumorous tissue as determined by quantitative polymerase chain reaction and induction of PD-L1 by INFγ stimulation in vitro. Correlation studies were performed for (A) PD-L1 and CD8+ (B) PD-L1 and INFγ (C) INFγ and CD8+ in 45 HCC patients' tumor tissues, GAPDH was used as an internal control. r : Spearman's correlation coefficient. (D) Western blot detection of PD-L1 expression in HCC cell lines in the presence or absence of 20 ng/mL INFγ for 24 h. Total protein (50 µg) was loaded in each lane.
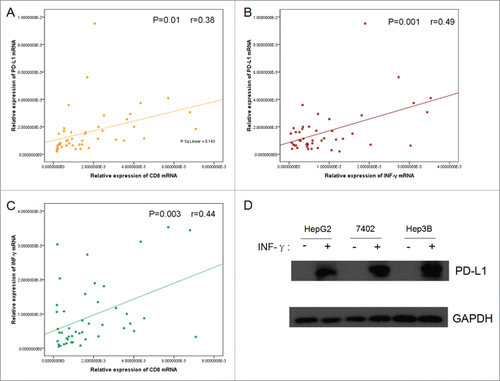
Figure 4. Correlation among the relative expression of PD-L1, CD8+, and INFγ, in tumorous tissue as determined by quantitative polymerase chain reaction and induction of PD-L1 by INFγ stimulation in vitro. Correlation studies were performed for (A) PD-L1 and CD8+ (B) PD-L1 and INFγ (C) INFγ and CD8+ in 45 HCC patients' tumor tissues, GAPDH was used as an internal control. r : Spearman's correlation coefficient. (D) Western blot detection of PD-L1 expression in HCC cell lines in the presence or absence of 20 ng/mL INFγ for 24 h. Total protein (50 µg) was loaded in each lane.

Figure 5. PD-L1 and CD8+ density are correlated with superior disease-free survival (DFS) and overall survival (OS) of HCC patients. (A, B) Kaplan–Meier curves for the analysis of HCC patients. (A) DFS and (B) OS according to PD-L1 protein levels. p values were calculated by log-rank test. (C, D) Kaplan–Meier curves for the analysis of (C) DFS and (D) OS in HCC patients according to CD8+ density. p values were calculated by log-rank test.
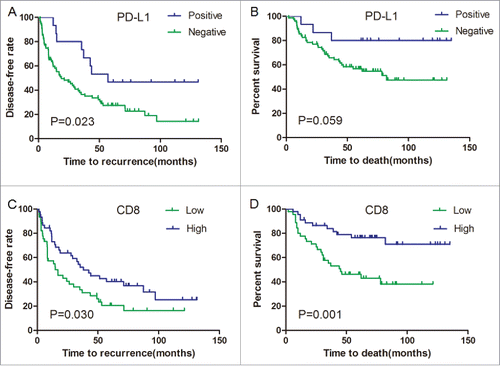
Figure 5. PD-L1 and CD8+ density are correlated with superior disease-free survival (DFS) and overall survival (OS) of HCC patients. (A, B) Kaplan–Meier curves for the analysis of HCC patients. (A) DFS and (B) OS according to PD-L1 protein levels. p values were calculated by log-rank test. (C, D) Kaplan–Meier curves for the analysis of (C) DFS and (D) OS in HCC patients according to CD8+ density. p values were calculated by log-rank test.

Table 3. Univariate and multivariate analyses for DFS.

Table 4. Univariate and multivariate analyses for OS.

Supplemental material

KONI_A_1181252_supplementary_materials.zip

Download Zip (7 MB)

Reprints and Corporate Permissions

Please note: Selecting permissions does not provide access to the full text of the article, please see our help page How do I view content?

To request a reprint or corporate permissions for this article, please click on the relevant link below:

Academic Permissions

Please note: Selecting permissions does not provide access to the full text of the article, please see our help page How do I view content?

Obtain permissions instantly via Rightslink by clicking on the button below:

If you are unable to obtain permissions via Rightslink, please complete and submit this Permissions form. For more information, please visit our Permissions help page.