1,072
Views
25
CrossRef citations to date
0
Altmetric
Original Research

The association of clinical outcome and peripheral T-cell subsets in metastatic colorectal cancer patients receiving first-line FOLFIRI plus bevacizumab therapy

, , , , , , , , & show all
Article: e1188243 | Received 05 Feb 2016, Accepted 05 May 2016, Published online: 13 Jul 2016

Figures & data

Figure 1. Therapy-induced changes in the ratio of CD4+ effectors to regulatory T cells (Tregs), and in the immunosuppressive activity of Tregs in patients with colorectal cancer. (A) Waterfall plot of the change in the ratio between CD4+ effector T cells and regulatory T cells (CD4+:Treg ratio) in the course of FOLFIRI therapy in patients (n = 23) with first-line metastatic colorectal cancer. (B) Enough peripheral blood mononuclear cells (PBMCs) from 13 patients were available to measure suppressive activity of Tregs. Waterfall plot of the change in suppressive activity of Tregs after FOLFIRI therapy, compared to baseline, in patients with first-line metastatic colorectal cancer. Peripheral blood samples were collected at baseline and after 30 d of therapy.
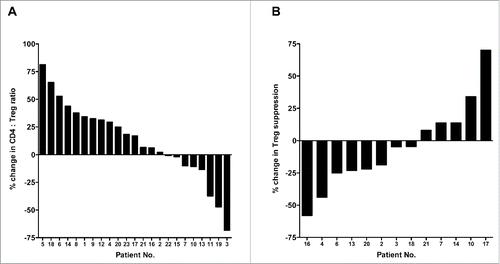
Figure 1. Therapy-induced changes in the ratio of CD4+ effectors to regulatory T cells (Tregs), and in the immunosuppressive activity of Tregs in patients with colorectal cancer. (A) Waterfall plot of the change in the ratio between CD4+ effector T cells and regulatory T cells (CD4+:Treg ratio) in the course of FOLFIRI therapy in patients (n = 23) with first-line metastatic colorectal cancer. (B) Enough peripheral blood mononuclear cells (PBMCs) from 13 patients were available to measure suppressive activity of Tregs. Waterfall plot of the change in suppressive activity of Tregs after FOLFIRI therapy, compared to baseline, in patients with first-line metastatic colorectal cancer. Peripheral blood samples were collected at baseline and after 30 d of therapy.

Table 1. Patient demographics and clinical characteristics.

Table 2. Evaluation of immune cell subsets in colorectal cancer patients prior to and after 30 d of standard-of-care anticancer therapy.

Figure 2. Therapy-induced changes in the ratios of CD8+ effectors to regulatory T cells in patients with colorectal cancer. Waterfall plot of the change in the ratio between CD8+ effector T cells and regulatory T cells (CD8+:Treg ratio) in the course of FOLFIRI therapy in patients with first-line metastatic colorectal cancer (n = 23). Peripheral blood samples were collected at baseline and after 30 d of therapy.
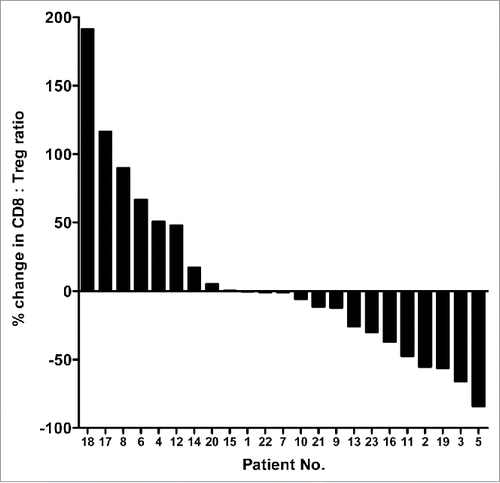
Figure 2. Therapy-induced changes in the ratios of CD8+ effectors to regulatory T cells in patients with colorectal cancer. Waterfall plot of the change in the ratio between CD8+ effector T cells and regulatory T cells (CD8+:Treg ratio) in the course of FOLFIRI therapy in patients with first-line metastatic colorectal cancer (n = 23). Peripheral blood samples were collected at baseline and after 30 d of therapy.

Figure 3. Association between the frequency of regulatory T cells (Tregs) in peripheral blood mononuclear cells (PBMCs) at baseline and progression-free survival (PFS) after FOLFIRI therapy in patients with colorectal cancer. Patients were categorized based on their frequency of Tregs (< or > 25% of PBMCs) before therapy. A Kaplan–Meier curve is shown for these two groups and the association with PFS. The median PFS for patients with <2.5% Tregs pre-treatment was 23.3 months, and for patients with >2.5% Tregs pre-treatment 10.7 months (p = 0.037, n = 23, 3 patients were censored).
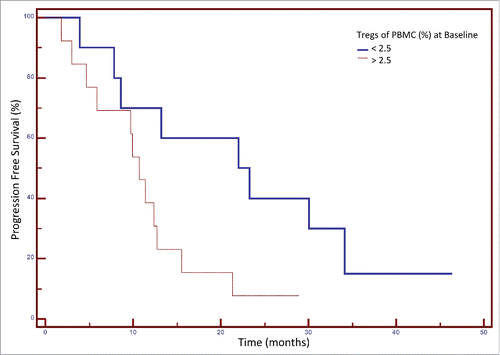
Figure 3. Association between the frequency of regulatory T cells (Tregs) in peripheral blood mononuclear cells (PBMCs) at baseline and progression-free survival (PFS) after FOLFIRI therapy in patients with colorectal cancer. Patients were categorized based on their frequency of Tregs (< or > 25% of PBMCs) before therapy. A Kaplan–Meier curve is shown for these two groups and the association with PFS. The median PFS for patients with <2.5% Tregs pre-treatment was 23.3 months, and for patients with >2.5% Tregs pre-treatment 10.7 months (p = 0.037, n = 23, 3 patients were censored).

Figure 4. Association between the change in regulatory T cell (Treg) frequency in peripheral blood mononuclear cells (PBMCs) after FOLFIRI therapy and overall survival (OS) in patients with colorectal cancer. Patients were categorized based on any decrease or increase in Treg frequency after 30 d of FOLFIRI therapy. (A) A Kaplan–Meier curve is shown for these two groups and the association with OS. The median OS for patients with decreased Tregs after 30 d treatment was 43.3 mo, and for patients with increased Tregs after treatment, OS was 23.3 mo (p = 0.036, n = 23). The change in Treg frequency was found to be an independent predictive variable for OS by stepwise multiple regression analysis. (B) The median decrease in Treg frequency was −26%. (C) The median increase in Treg frequency was +23%.
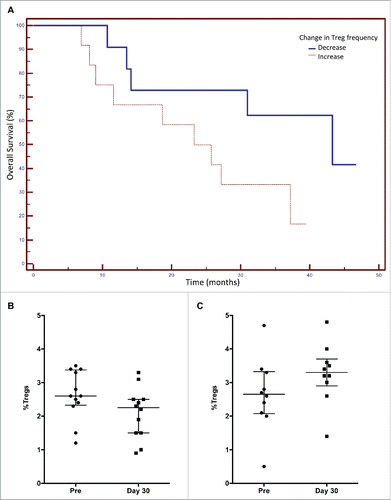
Figure 4. Association between the change in regulatory T cell (Treg) frequency in peripheral blood mononuclear cells (PBMCs) after FOLFIRI therapy and overall survival (OS) in patients with colorectal cancer. Patients were categorized based on any decrease or increase in Treg frequency after 30 d of FOLFIRI therapy. (A) A Kaplan–Meier curve is shown for these two groups and the association with OS. The median OS for patients with decreased Tregs after 30 d treatment was 43.3 mo, and for patients with increased Tregs after treatment, OS was 23.3 mo (p = 0.036, n = 23). The change in Treg frequency was found to be an independent predictive variable for OS by stepwise multiple regression analysis. (B) The median decrease in Treg frequency was −26%. (C) The median increase in Treg frequency was +23%.

Table 3. Clinical characteristics of patients enrolled on the study

Table 4. Multiple regression analysis of variables associated with overall survival.

Supplemental material

KONI_A_1188243_s02.docx

Download MS Word (16.3 KB)

Reprints and Corporate Permissions

Please note: Selecting permissions does not provide access to the full text of the article, please see our help page How do I view content?

To request a reprint or corporate permissions for this article, please click on the relevant link below:

Academic Permissions

Please note: Selecting permissions does not provide access to the full text of the article, please see our help page How do I view content?

Obtain permissions instantly via Rightslink by clicking on the button below:

If you are unable to obtain permissions via Rightslink, please complete and submit this Permissions form. For more information, please visit our Permissions help page.