1,418
Views
9
CrossRef citations to date
0
Altmetric
Original Research

IL12-mediated sensitizing of T-cell receptor-dependent and -independent tumor cell killing

, , , , , & show all
Article: e1188245 | Received 04 Mar 2016, Accepted 05 May 2016, Published online: 11 Jul 2016

Figures & data

Figure 1. IL12 increases TCR sensitivity toward cognate antigen. (A) Experimental setting. After priming of Melan-A(26–35(27L)) specific T cells various cytokines were added after pooling of wells on day +8. IL7 and IL15 was present throughout the assay to ensure survival. 48 h later cells were evaluated for overall count, the percentage of Melan-A-multimer+ CD8+ T-cells and cytokine production upon restimulation. (B) Upper row: Representative dot plots of MHC-multimer-staining with no addition of inflammatory cytokines (standard, left), the addition of 10 ng/mL IL12 (middle) and interferon-α 450 IU/mL (right). Middle row: Staining of intracellular cytokines of CD8+ T cells stimulated with Melan-A(26–35(27L)) peptide (10 ng/mL; 2nd row) or bottom row: irrelevant peptide CYP1B1(239–247) (103 ng/mL; 3rd row), gated on CD8+. (C) Absolute cell counts (left) and percentages of multimer+ T-cells (right) on d + 10 of un- or IL12 treated cells in indicated dosages (Mean and SD, results from more than five experiments). (D) MFI values on d + 11 of interferon-γ and TNF-α in untreated or IL12 treated T cells stimulated with Melan-A(26–35(27L)) peptide loaded on autologous monocytes (103 ng/mL). Results are from five independent experiments. MFI of irrelevant peptide-pulsed monocytes is subtracted. (E) Log EC50 of interferon-γ and TNF-α was calculated from the response curves for each indicated cytokine. Indicated is the difference to “standard” (= no additional inflammatory cytokine, only IL7/IL15) treatment. Results are from five independent experiments, each cytokine was tested at least three times. *p < 0.05; **p < 0.01.(F) Upper panel: representative response curves of interferon-γ and TNF-α, gated on CD8+ T cells. The percentage of cytokine+ T cells is put in relation to the respective percentage of MHC-multimer+CD8+ T cells in each sample. Lower panel: Changes in logEC50 from five independent experiments of interferon-γ and TNF-α no IL12 vs. IL12 (10 ng/mL) normalized for CD8+multimer+ T cells. Log EC50 of interferon-γ and TNF-α was calculated from the response curves for each indicated cytokine. Indicated is the difference to “standard” (= no additional cytokine) treatment.
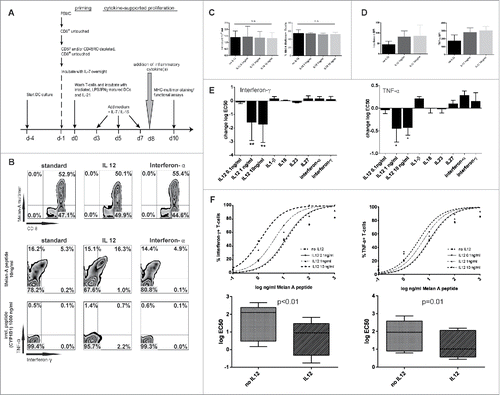
Figure 1. IL12 increases TCR sensitivity toward cognate antigen. (A) Experimental setting. After priming of Melan-A(26–35(27L)) specific T cells various cytokines were added after pooling of wells on day +8. IL7 and IL15 was present throughout the assay to ensure survival. 48 h later cells were evaluated for overall count, the percentage of Melan-A-multimer+ CD8+ T-cells and cytokine production upon restimulation. (B) Upper row: Representative dot plots of MHC-multimer-staining with no addition of inflammatory cytokines (standard, left), the addition of 10 ng/mL IL12 (middle) and interferon-α 450 IU/mL (right). Middle row: Staining of intracellular cytokines of CD8+ T cells stimulated with Melan-A(26–35(27L)) peptide (10 ng/mL; 2nd row) or bottom row: irrelevant peptide CYP1B1(239–247) (103 ng/mL; 3rd row), gated on CD8+. (C) Absolute cell counts (left) and percentages of multimer+ T-cells (right) on d + 10 of un- or IL12 treated cells in indicated dosages (Mean and SD, results from more than five experiments). (D) MFI values on d + 11 of interferon-γ and TNF-α in untreated or IL12 treated T cells stimulated with Melan-A(26–35(27L)) peptide loaded on autologous monocytes (103 ng/mL). Results are from five independent experiments. MFI of irrelevant peptide-pulsed monocytes is subtracted. (E) Log EC50 of interferon-γ and TNF-α was calculated from the response curves for each indicated cytokine. Indicated is the difference to “standard” (= no additional inflammatory cytokine, only IL7/IL15) treatment. Results are from five independent experiments, each cytokine was tested at least three times. *p < 0.05; **p < 0.01.(F) Upper panel: representative response curves of interferon-γ and TNF-α, gated on CD8+ T cells. The percentage of cytokine+ T cells is put in relation to the respective percentage of MHC-multimer+CD8+ T cells in each sample. Lower panel: Changes in logEC50 from five independent experiments of interferon-γ and TNF-α no IL12 vs. IL12 (10 ng/mL) normalized for CD8+multimer+ T cells. Log EC50 of interferon-γ and TNF-α was calculated from the response curves for each indicated cytokine. Indicated is the difference to “standard” (= no additional cytokine) treatment.

Figure 2. IL12 enhances antigen-specific cytotoxicity and retains CD62L expression. (A) Representative dot plots with gating strategy for Melan-A-MHC-multimer purified T cells. (B) MHC-multimer-purified Melan-A sp T-cells were cultivated with or without IL12 (10 ng/mL) for 48 h and then used in a caspase-3 apoptosis assay against the HLA-A02:01+ melanoma cell line FM55 (without exogenous peptides). HLA-ABC blocking antibody W6/32 (10 µg/mL) was added to the tumor cells 15 min before the T cells were added and was present during the assay. After 4 h tumor cells were stained for activated caspase-3 (for the gating strategy see ). E/T-ratio 2:1. Mean and SD from three independent experiments. (C) Melan-A sp. T cells in the proliferative phase were incubated for additional 48 h with or without IL12 and analyzed for various surface markers (gated on CD8+ MHC-multimer+ T cells as shown in ). Right panels: Summary of ten experiments, depicted as change in MFI (x-fold over isotype, mean and quartiles). For additional results see Fig. S1E. (D) Representative histograms of T-bet- and Granzyme B-expression. Filled: isotype, dashed line indicates no IL12, continuous line with IL12 treatment. Right: Summary of more than five experiments as MFI results (x-fold over isotype) are from more five experiments, including clonal cell populations (STEAP1, PRAME and clonal Melan-A cells). For all experiments in C and D: box, line and whiskers indicate: 25th to 75th percentile, median and min. to max. Significance was corrected for multiple comparisons.
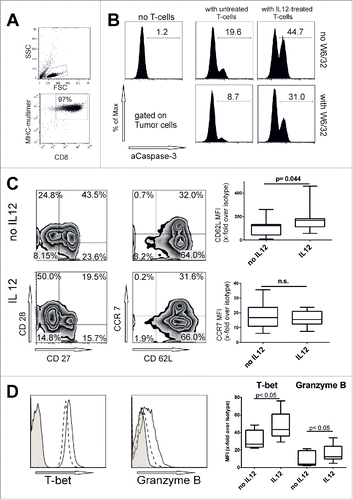
Figure 2. IL12 enhances antigen-specific cytotoxicity and retains CD62L expression. (A) Representative dot plots with gating strategy for Melan-A-MHC-multimer purified T cells. (B) MHC-multimer-purified Melan-A sp T-cells were cultivated with or without IL12 (10 ng/mL) for 48 h and then used in a caspase-3 apoptosis assay against the HLA-A02:01+ melanoma cell line FM55 (without exogenous peptides). HLA-ABC blocking antibody W6/32 (10 µg/mL) was added to the tumor cells 15 min before the T cells were added and was present during the assay. After 4 h tumor cells were stained for activated caspase-3 (for the gating strategy see Fig. 3B). E/T-ratio 2:1. Mean and SD from three independent experiments. (C) Melan-A sp. T cells in the proliferative phase were incubated for additional 48 h with or without IL12 and analyzed for various surface markers (gated on CD8+ MHC-multimer+ T cells as shown in Fig. 2A). Right panels: Summary of ten experiments, depicted as change in MFI (x-fold over isotype, mean and quartiles). For additional results see Fig. S1E. (D) Representative histograms of T-bet- and Granzyme B-expression. Filled: isotype, dashed line indicates no IL12, continuous line with IL12 treatment. Right: Summary of more than five experiments as MFI results (x-fold over isotype) are from more five experiments, including clonal cell populations (STEAP1, PRAME and clonal Melan-A cells). For all experiments in C and D: box, line and whiskers indicate: 25th to 75th percentile, median and min. to max. Significance was corrected for multiple comparisons.

Figure 3. Interleukin 12 enables T-cell-clones for HLA-dependent and independent cytolytic activity. (A) PRAME sp. clonal T cells were stimulated with PRAME(435–443) loaded HLA-A02:01+ monocytes in increasing peptide concentration (101 to 104 ng/mL PRAME(435–443) peptide in the presence of Brefeldin A for 5 h. E/T ratio was 2:1. Cells were then stained for intracellular cytokines and response curve for interferon-γ and TNF-α were calculated. Representative of three independent experiments. (B) Gating strategy and representative dot plots of a caspase-3 assay with STEAP-1 sp. clonal T-cells against Ewing's sarcoma cell line TC71 (HLA-A02:01+). A CD8+-CD45- tumor cell gate was set and activated caspase-3 was evaluated. Where indicated, T cells were added at E/T ratio of 20:1. As positive control, tumor cells were peptide-loaded overnight (103 ng/mL) and washed thoroughly before addition of T cells. (C) Caspase-3 assay of STEAP1 or PRAME sp. clonal T cells against various tumor cell lines. T cells were or were not pre-incubated with IL12 (10 ng/mL) for 48 h. Spontaneous activation of caspase-3 for each tumor cell line is subtracted. Mean of five independent experiments.
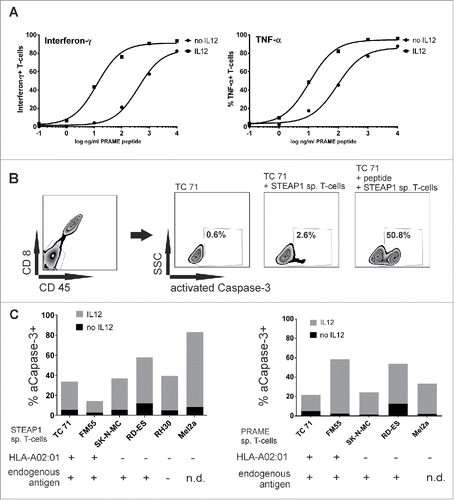
Figure 3. Interleukin 12 enables T-cell-clones for HLA-dependent and independent cytolytic activity. (A) PRAME sp. clonal T cells were stimulated with PRAME(435–443) loaded HLA-A02:01+ monocytes in increasing peptide concentration (101 to 104 ng/mL PRAME(435–443) peptide in the presence of Brefeldin A for 5 h. E/T ratio was 2:1. Cells were then stained for intracellular cytokines and response curve for interferon-γ and TNF-α were calculated. Representative of three independent experiments. (B) Gating strategy and representative dot plots of a caspase-3 assay with STEAP-1 sp. clonal T-cells against Ewing's sarcoma cell line TC71 (HLA-A02:01+). A CD8+-CD45- tumor cell gate was set and activated caspase-3 was evaluated. Where indicated, T cells were added at E/T ratio of 20:1. As positive control, tumor cells were peptide-loaded overnight (103 ng/mL) and washed thoroughly before addition of T cells. (C) Caspase-3 assay of STEAP1 or PRAME sp. clonal T cells against various tumor cell lines. T cells were or were not pre-incubated with IL12 (10 ng/mL) for 48 h. Spontaneous activation of caspase-3 for each tumor cell line is subtracted. Mean of five independent experiments.

Figure 4. HLA-independent tumor-cell lysis is mediated by DNAM-1. (A) Caspase-3 assay against HLA-A02:01+, STEAP1+ Ewing's sarcoma cell line TC71. T-cell clones were pre-incubated with IL12 for 48 h. IL12 (10 ng/mL), Dasatinib (50 nM) or HLA-class I blocking antibody W6/32 (10 µg/mL) were present during the assay when indicated. Mean of three different experiments. (B) Caspase-3 assay in HLA-A02:01-melanoma cell line Mel2a (right), HLA-A02:01+, antigen positive Ewing's sarcoma cell line TC71 (left) with STEAP1 specific clonal T cells. E/T ratio 20:1. T cells were or were not pre-incubated for 48 h with 10 ng/mL IL12. Src-inhibitor-1 (100 nM), DNAM-1 blocking antibody DX11 (10 µg/mL) and NKG2D blocking antibody 1D11 (10 µg/mL) was added were indicated. Results from five independent experiments. (C) Purified Melan-A sp. T cells were pre-incubated for 48 h with or without 10 ng/mL IL12. Mel2a melanoma cells were used as targets. As indicated, dasatinib (50 nM), or various blocking antibodies (10 µg/mL) were added throughout the caspase-3 assay(E/T ratio was 2:1). (D) Summary of similar experiments as in (C) with different tumor cell lines Results are from eight different experiments, 2/8 with clonal Melan-A population (two different clones).
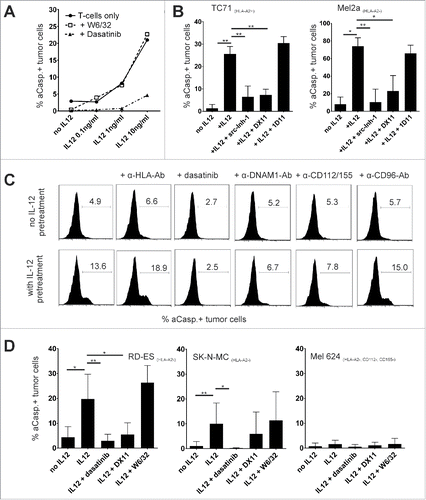
Figure 4. HLA-independent tumor-cell lysis is mediated by DNAM-1. (A) Caspase-3 assay against HLA-A02:01+, STEAP1+ Ewing's sarcoma cell line TC71. T-cell clones were pre-incubated with IL12 for 48 h. IL12 (10 ng/mL), Dasatinib (50 nM) or HLA-class I blocking antibody W6/32 (10 µg/mL) were present during the assay when indicated. Mean of three different experiments. (B) Caspase-3 assay in HLA-A02:01-melanoma cell line Mel2a (right), HLA-A02:01+, antigen positive Ewing's sarcoma cell line TC71 (left) with STEAP1 specific clonal T cells. E/T ratio 20:1. T cells were or were not pre-incubated for 48 h with 10 ng/mL IL12. Src-inhibitor-1 (100 nM), DNAM-1 blocking antibody DX11 (10 µg/mL) and NKG2D blocking antibody 1D11 (10 µg/mL) was added were indicated. Results from five independent experiments. (C) Purified Melan-A sp. T cells were pre-incubated for 48 h with or without 10 ng/mL IL12. Mel2a melanoma cells were used as targets. As indicated, dasatinib (50 nM), or various blocking antibodies (10 µg/mL) were added throughout the caspase-3 assay(E/T ratio was 2:1). (D) Summary of similar experiments as in (C) with different tumor cell lines Results are from eight different experiments, 2/8 with clonal Melan-A population (two different clones).

Table 1. CD112 and CD115 expression of various tumor cell lines.

Figure 5. IL12 enabled DNAM-1 mediated cytotoxicity is dependent on CD45 phosphatase activity. (A) Left: Change in DNAM-1 MFI mediated by IL12. Summary from different T-cell populations (early central memory T cells (Melan A), effector memory T cells (clonal STEAP1-sp. and PRAME-sp. Populations)). Results are from more than 10 experiments. Right: representative histogram of DNAM-1 on Melan-A sp. T cells (d + 10) with (empty) and without (tinted) IL12 pre-incubation. Dark-gray: isotype control. (B) Left: change of MFI over isotype in CD45 and subtype expression in STEAP1-sp. clonal populations incubated or not with 10 ng/mL IL12. Right: representative histograms, dark gray is isotype control, light gray no IL12 and black line IL12 incubation. (C) STEAP1 sp. clonal T cells were or were not pre-incubated with IL12 and tested against TC71 Ewing's sarcoma cell line. Reagents were present during assay as indicated (dosages as in 4(B), CD45-inhibitor 3.5 µM) after a pre-incubation time of 90 min on the T cells. Results are from three different experiments, spontaneous apoptosis is subtracted. E/T-ratio 20:1.
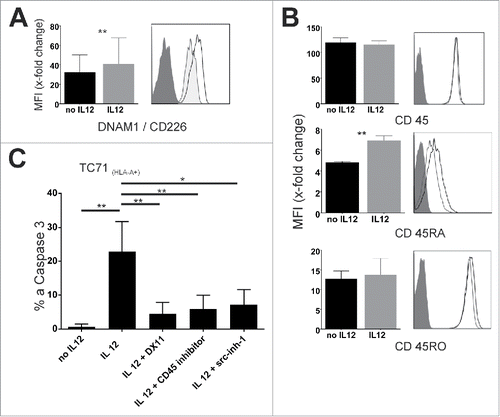
Figure 5. IL12 enabled DNAM-1 mediated cytotoxicity is dependent on CD45 phosphatase activity. (A) Left: Change in DNAM-1 MFI mediated by IL12. Summary from different T-cell populations (early central memory T cells (Melan A), effector memory T cells (clonal STEAP1-sp. and PRAME-sp. Populations)). Results are from more than 10 experiments. Right: representative histogram of DNAM-1 on Melan-A sp. T cells (d + 10) with (empty) and without (tinted) IL12 pre-incubation. Dark-gray: isotype control. (B) Left: change of MFI over isotype in CD45 and subtype expression in STEAP1-sp. clonal populations incubated or not with 10 ng/mL IL12. Right: representative histograms, dark gray is isotype control, light gray no IL12 and black line IL12 incubation. (C) STEAP1 sp. clonal T cells were or were not pre-incubated with IL12 and tested against TC71 Ewing's sarcoma cell line. Reagents were present during assay as indicated (dosages as in 4(B), CD45-inhibitor 3.5 µM) after a pre-incubation time of 90 min on the T cells. Results are from three different experiments, spontaneous apoptosis is subtracted. E/T-ratio 20:1.

Table 2. Change in gene expression relevant for src-family kinases through IL12 incubation.

Supplemental material

KONI_A_1188245_s02.zip

Download Zip (4.6 MB)

Reprints and Corporate Permissions

Please note: Selecting permissions does not provide access to the full text of the article, please see our help page How do I view content?

To request a reprint or corporate permissions for this article, please click on the relevant link below:

Academic Permissions

Please note: Selecting permissions does not provide access to the full text of the article, please see our help page How do I view content?

Obtain permissions instantly via Rightslink by clicking on the button below:

If you are unable to obtain permissions via Rightslink, please complete and submit this Permissions form. For more information, please visit our Permissions help page.