
Figures & data
Figure 1. Treatment with αCD20 and αCD137 enhances survival against B lymphoma. (A) Tumor injection and treatment design. 1 × 10⁵ BL3750 cells were injected intravenously at day (D) 0. Control Ig (2A3, 250 μg i.p.) or anti-CD20 (clone 5D2, 250 μg i.p.) was administered on day 4, and anti-CD137 (clone 3H3, 100 μg i.p.) either alone or in combination on day 5 in C57BL6 wild-type (WT) and various gene-targeted mice (FcRIII−/−, FcRIV−/−, and FcγR−/−). (B) Results are pooled from three independent experiments (n (2A3) = 24; n (5D2) = 31; n (3H3) = 12; n (5D2+3H3) = 34). Statistical analysis was calculated using Mantel–Cox test. **p < 0.01 and ***p < 0.001 as indicated. (C) Results representative from one experiment, n = 6 each group. *p < 0.05 and **p < 0.01 as indicated. (D) Results representative from one experiment, n = 6 each group. (E) Results are pooled from two independent experiments (n (2A3) = 14; n (5D2) = 15; n (3H3) = 6; n (5D2+3H3) = 16). Statistical analysis was calculated using Mantel–Cox test. **p < 0.01 as indicated. (F) Tumor inoculation (1 × 10⁵ BL3750 cells, i.v.) on D0 was followed by administration of anti-CD20 (clone 5D2, 250 μg i.p.) on day 4, and anti-CD137 (clone 3H3, 100 μg i.p.) at day 5, either alone or in combination in C57BL6 WT mice. Antibody treatment was then applied weekly until sacrifice. Data shown is pooled from two independent experiments (n (2A3) = 16, n (5D2) = 6, n (3H3) = 6, n (5D2+3H3) = 16). **p < 0.001, and ***p < 0.001 as indicated. (G) WT mice survival after single treatment with anti-CD20 (clone 5D2, 250 μg i.p. 20 d after BL3750 inoculation) and anti-CD137 (clone 3H3, 100 μg i.p. 21 d after BL3750 inoculation). Results are representative of one experiment, n = 6, each group. **p < 0.01 as indicated.
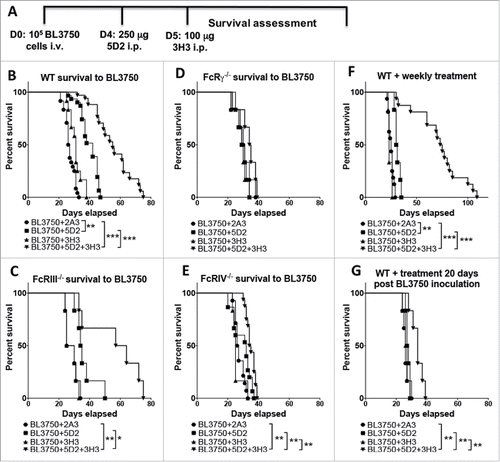
Figure 2. Treatment with αCD20 and αCD137 reduces blood B-cell numbers in mice bearing B-cell lymphoma. Blood samples were collected for hemogram assessment according to the experimental design shown in (A). 1 × 10⁵ BL3750 cells were injected i.v. at D0, and followed by treatment with control Ig (2A3, 250 μg i.p.) or anti-CD20 (clone 5D2, 250 μg i.p.) on day 4, and anti-CD137 (clone 3H3, 100 μg i.p.) either alone or in combination on day 5 in C57BL6 WT or various FcR-deficient mice, as indicated. Peripheral blood lymphocyte (B), and B cell numbers (C). Results are representative of one experiment n = 6 per group. Statistical analysis was calculated using Multiple T tests using the Holm–Sidak Method for multiple comparisons, where *p < 0.05 was considered statistically significant between respective anti-CD137 (clone 3H3), anti-CD20 (clone 5D2), 5D2 + 3H3 groups versus (2A3) isotype control-treated mice.
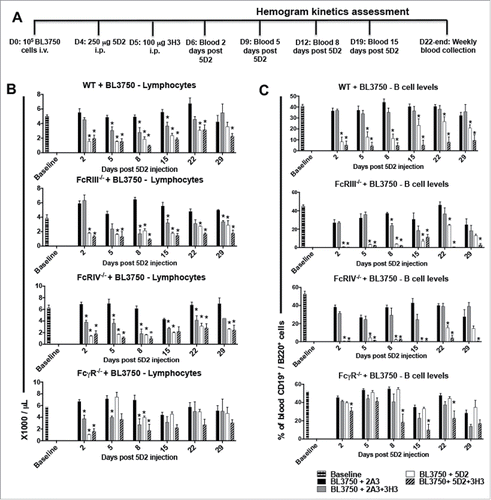
Figure 3. Treatment with αCD20 and αCD137 induces BAFF and cytokines in plasma with or without B lymphoma inoculation. Control Ig (2A3, 250 μg i.p.) or anti-CD20 (clone 5D2, 250 μg i.p.) was administered on day (D) 0, and anti-CD137 (clone 3H3, 100 μg i.p.) either alone or in combination on D1 in C57BL6 wild-type (WT) or gene-targeted mice. In some experiments (B, D), 1 × 10⁵ BL3750 cells were injected intravenously on day (D) 0, and control Ig (2A3, 250 μg i.p.) or anti-CD20 (clone 5D2, 250 μg i.p.) was administered on day (D) 4, and anti-CD137 (clone 3H3, 100 μg i.p.) either alone or in combination on D5 in WT or gene-targeted mice. (A) and (B) BAFF assessment from plasma of mice at D2, D5, D8 and D15 post anti-CD20 treatment. Data is representative of two experiment, n = 5 each group (n = 10 total).
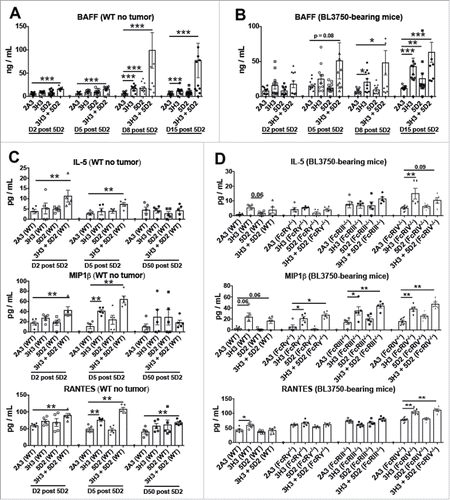
Figure 4. Sustained combination treatment of advanced tumor burden. (A) Experimental schedule of sustained 2A3, 3H3, 5D2, or 5D2 plus 3H3 treatment against advanced BL3750 lymphoma burden (treatment starting 14 d post BL3750 cells i.v. inoculation) as indicated. (B) H&E staining of livers 28 d after BL3750 inoculation reveals increased lymphocyte infiltration in 3H3 and 3H3 plus 5D2 treatment groups. Representative images from liver are shown. Scale bar = 1000 μm. Lymphocyte infiltrates (Ly) were observed in some treatments. (C) Lactic dehydrogenase reaction with eosin as background stain was performed in liver frozen sections (unfixed samples). Slides were scanned using 40x scan magnification. The Aperio Algorithm: Positive Pixel Count V9 was used to quantify positive pixels. A Hue Value = 0.65 was set up to exclude the background stain (eosin) from analysis and reveal the LDH stain intensity by pixels quantification (where yellow selected pixels = weak positive pixels; orange = positive pixels; red = strong positive pixels). (D) Representative LDH images from liver are shown in the first line according the treatment group, pixel selection by image analysis is represented in the line below. Scale bar = 1000 μm. (E): Weak, positive and strong positive pixel quantification from one field/liver/group are represented. Statistical analysis was performed using a Mann–Whitney test, **p < 0.01; n = 5.
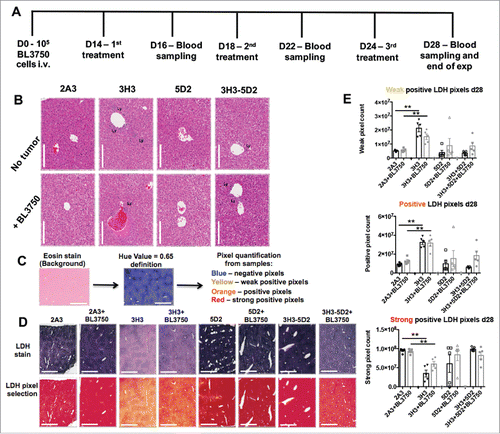
Figure 5. Circulating BAFF and ALT cell levels in mice after sustained combination therapy treatment of advanced lymphoma. Blood samples were collected for plasma assessment according to the experimental design shown in (A) BAFF was measured in plasma samples collected at day 16, day 22 and day 28 after tumor injection. Statistical analysis was performed using Mann–Whitney test, *p < 0.05 and **p < 0.01; n = 5 per group. (B) ALT was measured in plasma samples collected at the same time points after tumor injection. Statistical analysis was performed using Mann–Whitney test, *p < 0.05 and **p < 0.01; n = 5 per group.
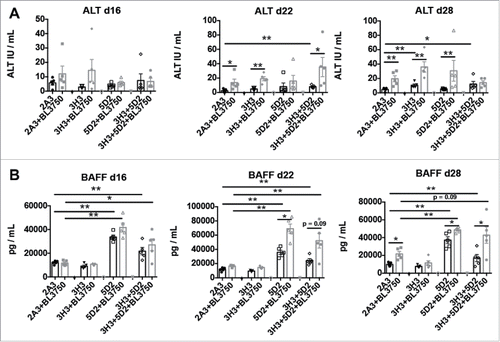
Table 1. Clinical trials of anti-CD137 mAb as monotherapy or in combination with rituximab.