1,671
Views
42
CrossRef citations to date
0
Altmetric
Original Research

Vaccination of stage III/IV melanoma patients with long NY-ESO-1 peptide and CpG-B elicits robust CD8+ and CD4+ T-cell responses with multiple specificities including a novel DR7-restricted epitope

, , , , , , , , , , , , , , , , & show all
Article: e1216290 | Received 04 May 2016, Accepted 18 Jul 2016, Published online: 27 Sep 2016

Figures & data

Table 1. Patients' characteristics.

Figure 1. Study design. Vaccinations (V) consisted of three cycles (C1–C3) of four monthly subcutaneous (s.c.) injections of 0.5 mg of NY-ESO-179–108 long peptide. HLA-A2+ patients were also vaccinated with 0.1 mg of Melan-A26–35 native peptide and 20 μg of Mage-A10254–262 peptide in the first cycle, followed by 0.1 mg Melan-A26–35(A27L) analog peptide and 0.1 mg of Mage-A10254–262 peptide in the following cycles. In addition, Group B patients were treated with low dose rh-IL-2. Peptides for HLA-A2+ patients were emulsified in 1 mL Montanide® ISA-51 and 2 mg CpG-7909/PF-3512676, peptides for HLA-A2 patients were emulsified in 0.5 mL Montanide® ISA-51 and 1 mg CpG-7909/PF-3512676. The three vaccines of the cycle 3 were formulated without Montanide. Blood samples were withdrawn and PBMC were prepared at baseline (100 mL), after two vaccinations (two samples at 7 d interval: 30 and 100 mL) and after four vaccinations (two samples at 7 d interval: 30 and 100 mL) for the assessment of immune responses.
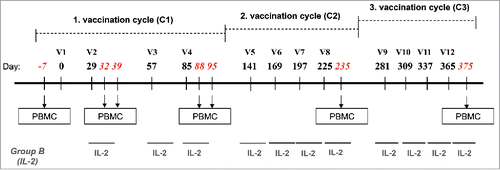
Figure 1. Study design. Vaccinations (V) consisted of three cycles (C1–C3) of four monthly subcutaneous (s.c.) injections of 0.5 mg of NY-ESO-179–108 long peptide. HLA-A2+ patients were also vaccinated with 0.1 mg of Melan-A26–35 native peptide and 20 μg of Mage-A10254–262 peptide in the first cycle, followed by 0.1 mg Melan-A26–35(A27L) analog peptide and 0.1 mg of Mage-A10254–262 peptide in the following cycles. In addition, Group B patients were treated with low dose rh-IL-2. Peptides for HLA-A2+ patients were emulsified in 1 mL Montanide® ISA-51 and 2 mg CpG-7909/PF-3512676, peptides for HLA-A2− patients were emulsified in 0.5 mL Montanide® ISA-51 and 1 mg CpG-7909/PF-3512676. The three vaccines of the cycle 3 were formulated without Montanide. Blood samples were withdrawn and PBMC were prepared at baseline (100 mL), after two vaccinations (two samples at 7 d interval: 30 and 100 mL) and after four vaccinations (two samples at 7 d interval: 30 and 100 mL) for the assessment of immune responses.

Figure 2. Specific CD8+ T-cell responses before and after vaccination with NY-ESO-1 LSP. (A) Representative example of a NY-ESO-1-specific CD8+ T-cell response 14 d after IVS. Cytokine secreting cells are enumerated after 6-hchallenging of the expanded cells with the NY-ESO-1 pool of overlapping peptides, or without any peptide as control. (B) Details of longitudinal NY-ESO-1-specific CD8+ T-cell responses (IFNγ, TNFα, and IL-2) measured individually in each patient before and during vaccination. (C) Polyfunctionality of NY-ESO-1-specific CD8+ T-cell responses assessed as IFNγ+TNFα+ or IFNγ+TNFα+IL-2+ cells, measured individually in each patient before and during vaccination. (D) Quantification of the contribution of each individual cytokine (IFNγ, TNFα, and IL-2) to the NY-ESO-1-specific CD8+ T-cell response, before and during vaccination. The mean of the response for each cytokine is shown for all patients grouped as % of the total response (that is defined as 100%). The magnitude (mean for all patients grouped) of the total response at each time point is indicated on the bottom of each pie.
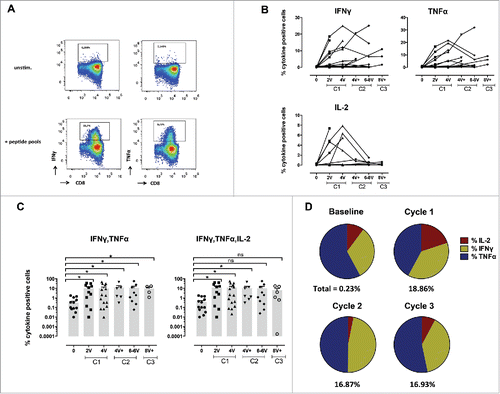
Figure 2. Specific CD8+ T-cell responses before and after vaccination with NY-ESO-1 LSP. (A) Representative example of a NY-ESO-1-specific CD8+ T-cell response 14 d after IVS. Cytokine secreting cells are enumerated after 6-hchallenging of the expanded cells with the NY-ESO-1 pool of overlapping peptides, or without any peptide as control. (B) Details of longitudinal NY-ESO-1-specific CD8+ T-cell responses (IFNγ, TNFα, and IL-2) measured individually in each patient before and during vaccination. (C) Polyfunctionality of NY-ESO-1-specific CD8+ T-cell responses assessed as IFNγ+TNFα+ or IFNγ+TNFα+IL-2+ cells, measured individually in each patient before and during vaccination. (D) Quantification of the contribution of each individual cytokine (IFNγ, TNFα, and IL-2) to the NY-ESO-1-specific CD8+ T-cell response, before and during vaccination. The mean of the response for each cytokine is shown for all patients grouped as % of the total response (that is defined as 100%). The magnitude (mean for all patients grouped) of the total response at each time point is indicated on the bottom of each pie.
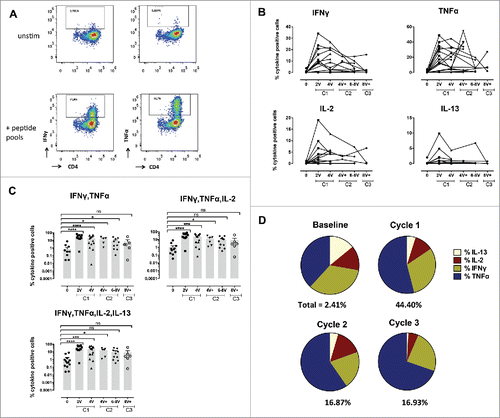
Figure 3. Specific CD4+ T-cell responses before and after vaccination with NY-ESO-1 LSP. (A) Representative example of a NY-ESO-1-specific CD4+ T-cell response 14 d after IVS. Cytokine secreting cells are enumerated after 6-h challenging of the expanded cells with the NY-ESO-1 pool of overlapping peptides, or without any peptide as control. (B) Details of longitudinal NY-ESO-1-specific CD4+ T-cell responses (IFNγ, TNFα, IL2, and IL-13) measured individually in each patient before and during vaccination. (C) Polyfunctionality of NY-ESO-1-specific CD4+ T-cell responses assessed as IFNγ+TNFα+, or IFNγ+TNFα+IL-2+, or IFNγ+TNFα+IL-2+IL-13+ cells, measured individually in each patient before and during vaccination. (D) Quantification of the contribution of each individual cytokine (IFNγ, TNFα, IL-13, and IL-2) to the NY-ESO-1-specific CD4+ T-cell responses, before and during vaccination. The mean of the response for each cytokine is shown for all patients grouped as % of the total response (that is defined as 100%). The magnitude (mean for all patients grouped) of the total response at each time point is indicated on the bottom of each pie.

Figure 3. Specific CD4+ T-cell responses before and after vaccination with NY-ESO-1 LSP. (A) Representative example of a NY-ESO-1-specific CD4+ T-cell response 14 d after IVS. Cytokine secreting cells are enumerated after 6-h challenging of the expanded cells with the NY-ESO-1 pool of overlapping peptides, or without any peptide as control. (B) Details of longitudinal NY-ESO-1-specific CD4+ T-cell responses (IFNγ, TNFα, IL2, and IL-13) measured individually in each patient before and during vaccination. (C) Polyfunctionality of NY-ESO-1-specific CD4+ T-cell responses assessed as IFNγ+TNFα+, or IFNγ+TNFα+IL-2+, or IFNγ+TNFα+IL-2+IL-13+ cells, measured individually in each patient before and during vaccination. (D) Quantification of the contribution of each individual cytokine (IFNγ, TNFα, IL-13, and IL-2) to the NY-ESO-1-specific CD4+ T-cell responses, before and during vaccination. The mean of the response for each cytokine is shown for all patients grouped as % of the total response (that is defined as 100%). The magnitude (mean for all patients grouped) of the total response at each time point is indicated on the bottom of each pie.

Figure 4. Summary of NY-ESO-1-specific CD8+ and CD4+ T-cell responses, and antibody responses. Cellular responses were measured 14 d after IVS and humoral responses were analyzed by ELISA against the NY-ESO-1 protein in plasma collected from enrolled patients' pre- treatment and during treatment as indicated.
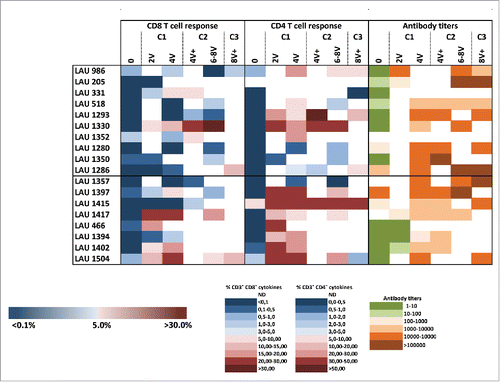
Figure 4. Summary of NY-ESO-1-specific CD8+ and CD4+ T-cell responses, and antibody responses. Cellular responses were measured 14 d after IVS and humoral responses were analyzed by ELISA against the NY-ESO-1 protein in plasma collected from enrolled patients' pre- treatment and during treatment as indicated.

Figure 5. Mapping of NY-ESO-1-specific CD8+ and CD4+ T-cell responses. (A) Using individual overlapping peptides covering the entire NY-ESO-1 LSP sequence, NY-ESO-1-specific CD8+ T-cell responses (n = 5 patients) and CD4+ T-cell responses (n = 9 patients) were mapped, by monitoring IFNγ + TNFα (CD8+ T-cells) and IFNγ (CD4+ T-cells) production after 6-h peptide challenge. (B) Representative example of NY-ESO-194–104/B35 multimer staining directly ex vivo and after IVS of CD8+ T-cells from HLA-B35+ patients. (C) MHC class II restriction of NY-ESO-1-specific CD4+ T-cell responses was assessed in a 6-h peptide challenge in the absence or presence of blocking anti-DR, -DP, or -DQ antibodies. Specific responses were measured by quantification of IFNγ production. (D) Representative example of NY-ESO-187–99/DR7 multimer staining of IVS CD4+ T-cells obtained from HLA-DR7+ patients, before and during immunization.
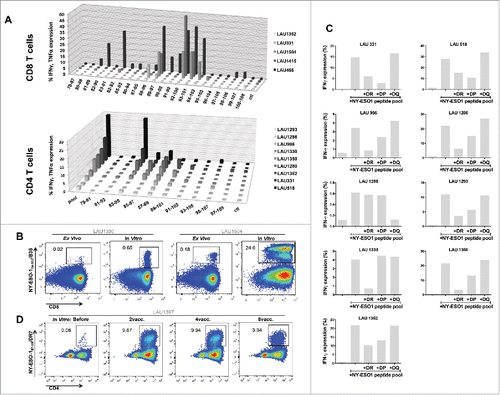
Figure 5. Mapping of NY-ESO-1-specific CD8+ and CD4+ T-cell responses. (A) Using individual overlapping peptides covering the entire NY-ESO-1 LSP sequence, NY-ESO-1-specific CD8+ T-cell responses (n = 5 patients) and CD4+ T-cell responses (n = 9 patients) were mapped, by monitoring IFNγ + TNFα (CD8+ T-cells) and IFNγ (CD4+ T-cells) production after 6-h peptide challenge. (B) Representative example of NY-ESO-194–104/B35 multimer staining directly ex vivo and after IVS of CD8+ T-cells from HLA-B35+ patients. (C) MHC class II restriction of NY-ESO-1-specific CD4+ T-cell responses was assessed in a 6-h peptide challenge in the absence or presence of blocking anti-DR, -DP, or -DQ antibodies. Specific responses were measured by quantification of IFNγ production. (D) Representative example of NY-ESO-187–99/DR7 multimer staining of IVS CD4+ T-cells obtained from HLA-DR7+ patients, before and during immunization.

Table 2. Summary of frequencies of NY-ESO-1/DR7-specific CD4+ T-cells, detected after one round of IVS in HLA-DR7+ patients.

Figure 6. NY-ESO-187–99 peptide represents a novel MHC class II epitope. A. NY-ESO-187–99-specific CD4+ T-cell clones were generated and stained with NY-ESO-1/DR7 multimers (upper panels). Reactivity to specific peptide was tested and EC50 was calculated for both Type1 and Type2 cytokines (lower panels). (B) NY-ESO-187–99-specific-CD4+ T-cell clones were assessed for their capacity to secrete IFNγ or kill HLA-DR7+ target T-cells, in the presence or absence of specific peptide. (C) Representative example of direct ex vivo multimer staining of NY-ESO-187–99-specific-CD4+ T-cells in HLA-DR7+ patients. (D) Summary of frequencies of direct ex vivo detectable NY-ESO-187–99-specific-CD4+ T-cells in HLA-DR7+ patients.
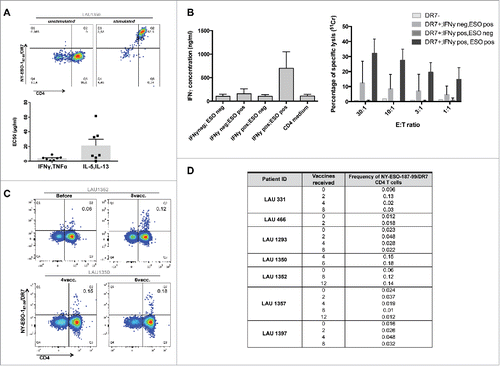
Figure 6. NY-ESO-187–99 peptide represents a novel MHC class II epitope. A. NY-ESO-187–99-specific CD4+ T-cell clones were generated and stained with NY-ESO-1/DR7 multimers (upper panels). Reactivity to specific peptide was tested and EC50 was calculated for both Type1 and Type2 cytokines (lower panels). (B) NY-ESO-187–99-specific-CD4+ T-cell clones were assessed for their capacity to secrete IFNγ or kill HLA-DR7+ target T-cells, in the presence or absence of specific peptide. (C) Representative example of direct ex vivo multimer staining of NY-ESO-187–99-specific-CD4+ T-cells in HLA-DR7+ patients. (D) Summary of frequencies of direct ex vivo detectable NY-ESO-187–99-specific-CD4+ T-cells in HLA-DR7+ patients.

Figure 7. Overall survival and progression-free survival depending on the maximal level of IFNγ+ NY-ESO-1-specific CD8+ T-cell (A) and CD4+ T-cell (B) frequencies reached during the study after IVS. (A). Overall survival (left panel) and progression-free survival (right panel) in patients with low frequencies of IFNγ+ NY-ESO-1-specific CD8+ T-cells (lower than the median, n = 9) and in patients with high frequencies of IFNγ+ NY-ESO-1-specific CD8+ T-cells (higher than the median, n = 9). (B) Overall survival (left panel) and progression-free survival (right panel) in patients with low frequencies of IFNγ+ NY-ESO-1-specific CD4+ T-cells (lower than the median, n = 9) and in patients with high frequencies of IFNγ+ NY-ESO-1-specific CD4+ T-cells (higher than the median, n = 9).
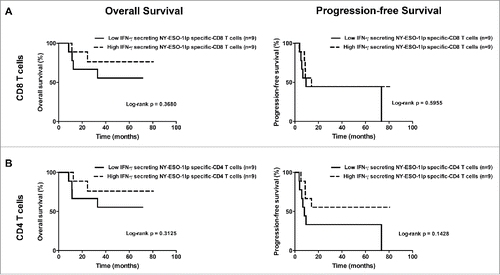
Figure 7. Overall survival and progression-free survival depending on the maximal level of IFNγ+ NY-ESO-1-specific CD8+ T-cell (A) and CD4+ T-cell (B) frequencies reached during the study after IVS. (A). Overall survival (left panel) and progression-free survival (right panel) in patients with low frequencies of IFNγ+ NY-ESO-1-specific CD8+ T-cells (lower than the median, n = 9) and in patients with high frequencies of IFNγ+ NY-ESO-1-specific CD8+ T-cells (higher than the median, n = 9). (B) Overall survival (left panel) and progression-free survival (right panel) in patients with low frequencies of IFNγ+ NY-ESO-1-specific CD4+ T-cells (lower than the median, n = 9) and in patients with high frequencies of IFNγ+ NY-ESO-1-specific CD4+ T-cells (higher than the median, n = 9).
Supplemental material

KONI_A_1216290_s02.pptx

Download MS Power Point (1.6 MB)

Reprints and Corporate Permissions

Please note: Selecting permissions does not provide access to the full text of the article, please see our help page How do I view content?

To request a reprint or corporate permissions for this article, please click on the relevant link below:

Academic Permissions

Please note: Selecting permissions does not provide access to the full text of the article, please see our help page How do I view content?

Obtain permissions instantly via Rightslink by clicking on the button below:

If you are unable to obtain permissions via Rightslink, please complete and submit this Permissions form. For more information, please visit our Permissions help page.