4,138
Views
83
CrossRef citations to date
0
Altmetric
Original Research

Vectorization in an oncolytic vaccinia virus of an antibody, a Fab and a scFv against programmed cell death -1 (PD-1) allows their intratumoral delivery and an improved tumor-growth inhibition

, , , , , , , , , , , , , , , , , & show all
Article: e1220467 | Received 23 Nov 2015, Accepted 30 Jul 2016, Published online: 11 Oct 2016

Figures & data

Figure 1. Schematic representation of the expression cassettes inserted in TK locus of the five WR vaccinia virus candidates constructed for this study. The insertion of cassettes disrupted the TK gene. The RR gene (not shown here) was also deleted in all the virus used in this study. For mAb and Fab each chain (heavy and light) is under the control of a different and independent promoter (namely p7.5K or pH5R) with their own strengths (i.e., level of protein expression). Mab corresponds to the whole molecule with two heavy and two light chains assembled to form a bivalent molecule 2 × (Light + Heavy). Fab corresponds to one light chain assembled with one heavy chain lacking their dimerization domains (i.e., hinge and Fc). Fab is a monovalent molecule. ScFv corresponds to the genetic fusion of VH to VL via a poly-GS linker. ScFv is monovalent molecule but a fraction of it can dimerize to form a divalent molecule. The variable and the constant domains of the light and heavy chains are represented with hatched and plain patterns, respectively.
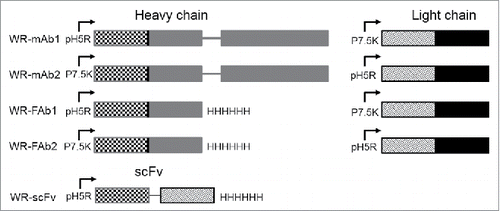
Figure 1. Schematic representation of the expression cassettes inserted in TK locus of the five WR vaccinia virus candidates constructed for this study. The insertion of cassettes disrupted the TK gene. The RR gene (not shown here) was also deleted in all the virus used in this study. For mAb and Fab each chain (heavy and light) is under the control of a different and independent promoter (namely p7.5K or pH5R) with their own strengths (i.e., level of protein expression). Mab corresponds to the whole molecule with two heavy and two light chains assembled to form a bivalent molecule 2 × (Light + Heavy). Fab corresponds to one light chain assembled with one heavy chain lacking their dimerization domains (i.e., hinge and Fc). Fab is a monovalent molecule. ScFv corresponds to the genetic fusion of VH to VL via a poly-GS linker. ScFv is monovalent molecule but a fraction of it can dimerize to form a divalent molecule. The variable and the constant domains of the light and heavy chains are represented with hatched and plain patterns, respectively.

Figure 2. Expression of mAb, Fab and scFv by infected CEF. CEF in six wells plate were infected at MOI 0.2 by either WR (TK- RR-: negative Control: lanes 1 and 7), WR-mAb1 (lane 2), WR-mAb2 (lane 3), WR-Fab2 (lanes 4 and 9), WR-Fab1 (lanes 5 and 10) and WR-scFv (lane 8). After 24 h of infection the culture supernatants were collected and loaded on SDS-PAGE in non-reducing (A) or reducing conditions (B). Commercially available J43 was also loaded (lane 6) as a reference. After transfer onto PVDF membrane, mAb, Fab and scFv were detected using either an anti-hamster IgG (A) or an anti-Histidine tag (B). M: molecular markers. Arrow: putative dimeric light chain. Arrow head: correctly assembled Fab.
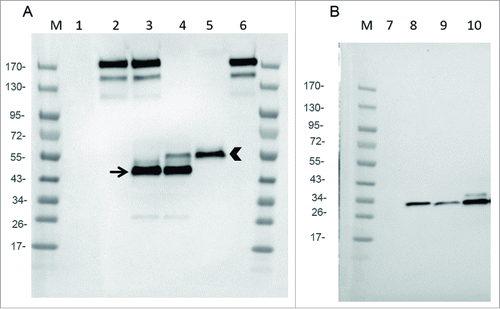
Figure 2. Expression of mAb, Fab and scFv by infected CEF. CEF in six wells plate were infected at MOI 0.2 by either WR (TK- RR-: negative Control: lanes 1 and 7), WR-mAb1 (lane 2), WR-mAb2 (lane 3), WR-Fab2 (lanes 4 and 9), WR-Fab1 (lanes 5 and 10) and WR-scFv (lane 8). After 24 h of infection the culture supernatants were collected and loaded on SDS-PAGE in non-reducing (A) or reducing conditions (B). Commercially available J43 was also loaded (lane 6) as a reference. After transfer onto PVDF membrane, mAb, Fab and scFv were detected using either an anti-hamster IgG (A) or an anti-Histidine tag (B). M: molecular markers. Arrow: putative dimeric light chain. Arrow head: correctly assembled Fab.

Figure 3. In vitro replication and oncolytic activities of the different viruses. Replication of WR-mAb1, WR-Fab1, WR-scFv and WR, and their effects on cell viability, have been assessed on MCA 205, B16F10 and BHK-21 cell lines. The virus replication was monitored over time by q-PCR after an initial infection at MOI 10−2 on BHK-21 (A), B16F10 (B) and MCA 205 (C). The replication of WR-mAb1 on the three cell lines was compared and shown in panel D. Cell viability of BHK-21 (E), B16F10 (F) and MCA 205 (G) was measured using trypan blue exclusion assay after 5 d post-infection with the different viruses and at two MOI (10−2 and 10−3). MAb1 concentration in supernatants collected 5 d post-infection was determined using a quantitative hamster IgG ELISA (H). Represented values are the mean (+/− standard deviation) of at least three measurements (see material and methods for details).
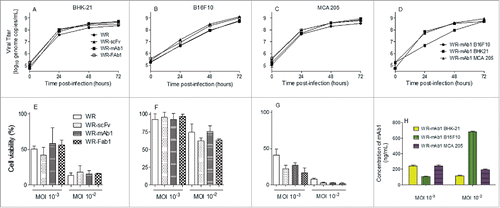
Figure 3. In vitro replication and oncolytic activities of the different viruses. Replication of WR-mAb1, WR-Fab1, WR-scFv and WR, and their effects on cell viability, have been assessed on MCA 205, B16F10 and BHK-21 cell lines. The virus replication was monitored over time by q-PCR after an initial infection at MOI 10−2 on BHK-21 (A), B16F10 (B) and MCA 205 (C). The replication of WR-mAb1 on the three cell lines was compared and shown in panel D. Cell viability of BHK-21 (E), B16F10 (F) and MCA 205 (G) was measured using trypan blue exclusion assay after 5 d post-infection with the different viruses and at two MOI (10−2 and 10−3). MAb1 concentration in supernatants collected 5 d post-infection was determined using a quantitative hamster IgG ELISA (H). Represented values are the mean (+/− standard deviation) of at least three measurements (see material and methods for details).

Figure 4. Characterization and quantification of mAb, Fab and scFv purified from supernatants of infected CEF. Size exclusion chromatography profile of scFv after the affinity chromatography step (A). ScFv eluting from the Ni affinity column was pooled and loaded of Superdex 75 10/300 equilibrated in PBS. Absorbance at 280 nm and elution volume were recorded. Area of peak 2 was about 7-fold area of peak 1. V0 is the void volume of the column. SDS-PAGE profiles of purified recombinant mAb1 and scFv in reducing and non-reducing conditions (B). 1 µg of purified recombinant mAb1 and scFv were loaded on SDS-PAGE in reducing (R) and non-reducing (NR) conditions. J43 (BioXcell) was loaded as reference in the case of mAb1. Quantification of mAb, Fab and scFv in supernatants of the infected cells (C). Supernatants of infected CEF were recovered 48 h after infection and loaded on stain-free SDS-PAGE together with corresponding purified and quantified molecules as standards. Fluorescence intensity of the bands of interest was measured for each supernatant. Quantity of produced protein was determined using the fluorescence of standards as reference. Represented values are the mean (+/− standard deviation) of three measurements.
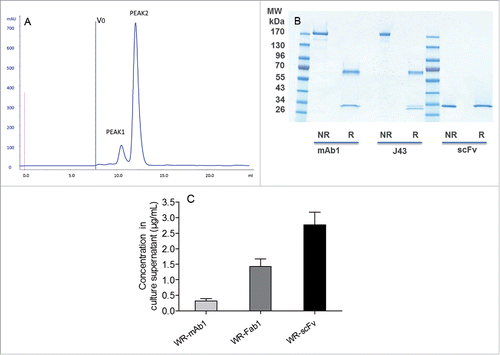
Figure 4. Characterization and quantification of mAb, Fab and scFv purified from supernatants of infected CEF. Size exclusion chromatography profile of scFv after the affinity chromatography step (A). ScFv eluting from the Ni affinity column was pooled and loaded of Superdex 75 10/300 equilibrated in PBS. Absorbance at 280 nm and elution volume were recorded. Area of peak 2 was about 7-fold area of peak 1. V0 is the void volume of the column. SDS-PAGE profiles of purified recombinant mAb1 and scFv in reducing and non-reducing conditions (B). 1 µg of purified recombinant mAb1 and scFv were loaded on SDS-PAGE in reducing (R) and non-reducing (NR) conditions. J43 (BioXcell) was loaded as reference in the case of mAb1. Quantification of mAb, Fab and scFv in supernatants of the infected cells (C). Supernatants of infected CEF were recovered 48 h after infection and loaded on stain-free SDS-PAGE together with corresponding purified and quantified molecules as standards. Fluorescence intensity of the bands of interest was measured for each supernatant. Quantity of produced protein was determined using the fluorescence of standards as reference. Represented values are the mean (+/− standard deviation) of three measurements.

Table 1. Quantities and concentrations of purified recombinant mAb1, Fab1 and scFv recovered from supernatants of WR-infected CEF.

Figure 5. Binding of the purified recombinant mAb1, Fab1, scFv to mPD-1. Binding of purified mAb1, Fab1 and scFv to mPD-1-positive EL4 cells (A). Murine T lymphoma EL4 cells were incubated with commercially available J43 (positive control), hamster IgG (negative control), Fab1, monomeric scFv, mCD80-hFc-6xHis (His-tagged positive control, CD80 binds to PD-L1 expressed by EL4 cells) or hErbB2-hFc-6xHis (His-tagged negative control). Binding of mAbs and 6xHis-tagged proteins was detected by flow cytometry using either FITC-conjugated mouse anti-hamster IgG antibody or PE-conjugated mouse anti-His tag antibody. Competition between purified recombinant mAb1, Fab1, scFv (monomeric and dimeric fractions), J43 and mPD-L1 (B and C). Binding of biotinylated mPD-L1-hFc to immobilized mPD-1, or binding of unlabeled mPD-L1-hFc to EL4 cells, in presence of increasing concentrations of competitors (J43, mAb1, Fab1, scFv) or negative control (Hamster IgG) was measured in ELISA (B) or flow cytometry (C) assays. PD-L1 was detected using either streptavidin-HRP or anti-human-Fc-PE. The signal obtained with the lowest concentration of hamster IgG was set as 100%. Represented values are the mean of two normalized measurements.
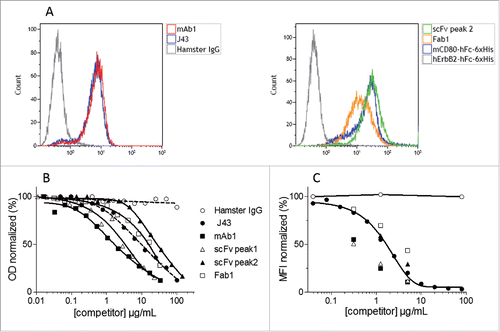
Figure 5. Binding of the purified recombinant mAb1, Fab1, scFv to mPD-1. Binding of purified mAb1, Fab1 and scFv to mPD-1-positive EL4 cells (A). Murine T lymphoma EL4 cells were incubated with commercially available J43 (positive control), hamster IgG (negative control), Fab1, monomeric scFv, mCD80-hFc-6xHis (His-tagged positive control, CD80 binds to PD-L1 expressed by EL4 cells) or hErbB2-hFc-6xHis (His-tagged negative control). Binding of mAbs and 6xHis-tagged proteins was detected by flow cytometry using either FITC-conjugated mouse anti-hamster IgG antibody or PE-conjugated mouse anti-His tag antibody. Competition between purified recombinant mAb1, Fab1, scFv (monomeric and dimeric fractions), J43 and mPD-L1 (B and C). Binding of biotinylated mPD-L1-hFc to immobilized mPD-1, or binding of unlabeled mPD-L1-hFc to EL4 cells, in presence of increasing concentrations of competitors (J43, mAb1, Fab1, scFv) or negative control (Hamster IgG) was measured in ELISA (B) or flow cytometry (C) assays. PD-L1 was detected using either streptavidin-HRP or anti-human-Fc-PE. The signal obtained with the lowest concentration of hamster IgG was set as 100%. Represented values are the mean of two normalized measurements.

Figure 6. In vivo expression of mAb1 after injection of WR-mAb1. C57BL/6 mice were implanted SC with either 3 105 B16F10 (A, C) or 8 105 MCA 205 cells (B, D). When tumors reached 100–200 mm2 (B16F10) or 40–60 mm2 (MCA 205), 107 pfu of WR-mAb1 or WR (negative control) or J43 (BioXcell, 10 µg) were injected IT. For mice without tumor, viruses were injected S.C. at the same time points. For MCA 205 tumors only, a second injection of the virus was performed 3 d after the first one. Blood, and tumors of three mice were collected at each time point i.e.: Days 1, 3 (MCA 205 only), 5, 7 (MCA 205 only) and 11 after virus or antibody injections. Concentrations of recombinant mAb or J43 were measured in tumor homogenates (A, B) or in sera (C, D) by sandwich ELISA using anti-hamster IgG antibodies and J43 as standard. The limit of quantification (LOQ = 2-fold the mean of blanks) of the ELISA was 2 ng/mL. The negative controls had no detectable hamster IgG (i.e., concentrations below the LOQ). The mean and the standard deviation of three measurements are represented.
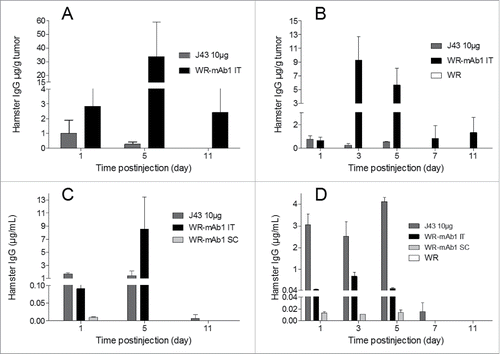
Figure 6. In vivo expression of mAb1 after injection of WR-mAb1. C57BL/6 mice were implanted SC with either 3 105 B16F10 (A, C) or 8 105 MCA 205 cells (B, D). When tumors reached 100–200 mm2 (B16F10) or 40–60 mm2 (MCA 205), 107 pfu of WR-mAb1 or WR (negative control) or J43 (BioXcell, 10 µg) were injected IT. For mice without tumor, viruses were injected S.C. at the same time points. For MCA 205 tumors only, a second injection of the virus was performed 3 d after the first one. Blood, and tumors of three mice were collected at each time point i.e.: Days 1, 3 (MCA 205 only), 5, 7 (MCA 205 only) and 11 after virus or antibody injections. Concentrations of recombinant mAb or J43 were measured in tumor homogenates (A, B) or in sera (C, D) by sandwich ELISA using anti-hamster IgG antibodies and J43 as standard. The limit of quantification (LOQ = 2-fold the mean of blanks) of the ELISA was 2 ng/mL. The negative controls had no detectable hamster IgG (i.e., concentrations below the LOQ). The mean and the standard deviation of three measurements are represented.

Table 2. Tumor/Serum ratio of concentrations of hamster IgG after I.T. injection of either J43 (BioXcell) or WR-mAb1. If one of the concentrations was below the LOQ, LOQ was used to calculate the ratio which appears in the table labeled with *. (NA: not applicable, ND: not detected, i.e., both concentrations in tumor and serum were below LOQ).

Figure 7. WR-mAb1 and WR-scFv have an improved tumor-growth inhibition activity compared to WR parental virus. MCA 205 tumors were implanted in C57BL/6 (n = 12) and treated as described in . Tumor growth was monitored by measuring length and width of the tumor over time. Mice were euthanized when tumor surface reached 300 mm2. Results are represented as the mean tumor size (A) or as survival percentage (B). Data from two combined experiments are shown. Statistical analysis were performed using a log-rank test to compare the effects of different viruses, pairwise comparison were adjusted with Tukey's correction and a mixed model was used to evaluate the impact of the viruses on the evolution over time of the tumor size. Hochberg's multiple tests correction was used. ***p < 0.001, ns non-significant.
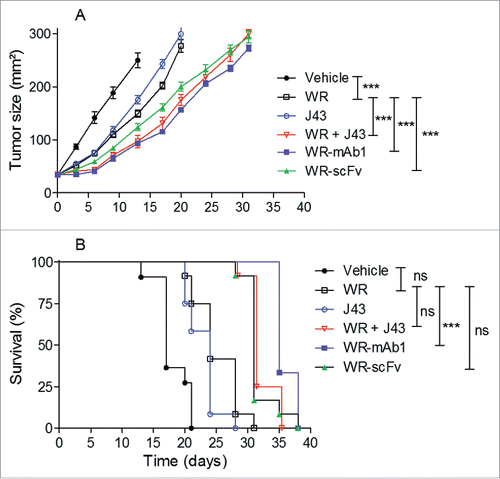
Figure 7. WR-mAb1 and WR-scFv have an improved tumor-growth inhibition activity compared to WR parental virus. MCA 205 tumors were implanted in C57BL/6 (n = 12) and treated as described in Fig. 6. Tumor growth was monitored by measuring length and width of the tumor over time. Mice were euthanized when tumor surface reached 300 mm2. Results are represented as the mean tumor size (A) or as survival percentage (B). Data from two combined experiments are shown. Statistical analysis were performed using a log-rank test to compare the effects of different viruses, pairwise comparison were adjusted with Tukey's correction and a mixed model was used to evaluate the impact of the viruses on the evolution over time of the tumor size. Hochberg's multiple tests correction was used. ***p < 0.001, ns non-significant.

Figure 8. Characterization of the tumor-infiltrating immune cells. MCA 205 tumors were implanted in C57BL/6 (n = 5) and treated as described in . Four days after the last injection of WR, tumors were processed for flow cytometry determination of the number of CD3+, CD4+, and CD8+ T cells (A). The ratio of CD8+ T cells to Treg cells (B) and the number of CD8+ IFNγ+ TNFα+ T cells (C) is also shown. The expression of the immune checkpoint PD-1 was also determined (D). *p < 0.05 by Mann-Whitney test.
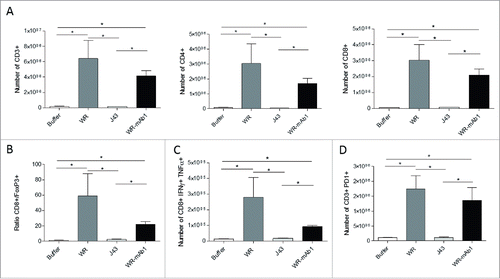
Figure 8. Characterization of the tumor-infiltrating immune cells. MCA 205 tumors were implanted in C57BL/6 (n = 5) and treated as described in Fig. 6. Four days after the last injection of WR, tumors were processed for flow cytometry determination of the number of CD3+, CD4+, and CD8+ T cells (A). The ratio of CD8+ T cells to Treg cells (B) and the number of CD8+ IFNγ+ TNFα+ T cells (C) is also shown. The expression of the immune checkpoint PD-1 was also determined (D). *p < 0.05 by Mann-Whitney test.
Supplemental material

KONI_A_1220467_s02.pptx

Download MS Power Point (244.4 KB)