1,092
Views
10
CrossRef citations to date
0
Altmetric
Original Research

Mini-intronic plasmid vaccination elicits tolerant LAG3+ CD8+ T cells and inferior antitumor responses

, &
Article: e1223002 | Received 16 May 2016, Accepted 06 Aug 2016, Published online: 27 Sep 2016

Figures & data

Figure 1. Construction of plasmids used. (A) Conventional plasmid encoding cancer-testis antigen SSX2 (pTVG-SSX2), as previously described.Citation27 (B) Minicircle DNA (DMC-SSX2) harboring an identical transgene expression cassette as pTVG-SSX2, created using the pMC.CMV-MCS-SV40polyA minicircle production vector and the ΦC31 integrase sensitive ZYCY10P3S2T E. coli strain (System Biosciences). (C) Mini-intronic plasmid encoding SSX2 (MIP-SSX2), obtained upon cloning of an OIPR intron containing a modified bacterial origin of replication, exonic splicing enhancers and a selectable RNA-OUT marker (Nature Technology Corporation), into a unique restriction site downstream of the CMV promoter in the DMC-SSX2 construct (as previously described).Citation20

Figure 1. Construction of plasmids used. (A) Conventional plasmid encoding cancer-testis antigen SSX2 (pTVG-SSX2), as previously described.Citation27 (B) Minicircle DNA (DMC-SSX2) harboring an identical transgene expression cassette as pTVG-SSX2, created using the pMC.CMV-MCS-SV40polyA minicircle production vector and the ΦC31 integrase sensitive ZYCY10P3S2T E. coli strain (System Biosciences). (C) Mini-intronic plasmid encoding SSX2 (MIP-SSX2), obtained upon cloning of an OIPR intron containing a modified bacterial origin of replication, exonic splicing enhancers and a selectable RNA-OUT marker (Nature Technology Corporation), into a unique restriction site downstream of the CMV promoter in the DMC-SSX2 construct (as previously described).Citation20

Figure 2. Delivery of MIP-SSX2 in vitro and in vivo resulted in elevated and sustained transgene expression. (A) Equimolar amounts of pTVG-SSX2 (2 µg) and MIP-SSX2 (1.6 µg) were used to transiently transfect LNCaP cells grown in low serum conditions. SSX2 production was assayed by quantitative ELISA on days 2 and 7 (n = 3 experimental replicates). pTVG4 = control plasmid vector not encoding SSX2. (B) Equimolar amounts of pTVG-SSX2 (30 µg) and MIP-SSX2 (24 µg) were administered to age-matched FVB mice (n = 3/group/time point) via tail vein injection. Livers were harvested on days 2, 7, and 14 and assayed for transgene expression using qRT-PCR. (* denotes a p-value < 0.05, two-sided t-test).

Figure 2. Delivery of MIP-SSX2 in vitro and in vivo resulted in elevated and sustained transgene expression. (A) Equimolar amounts of pTVG-SSX2 (2 µg) and MIP-SSX2 (1.6 µg) were used to transiently transfect LNCaP cells grown in low serum conditions. SSX2 production was assayed by quantitative ELISA on days 2 and 7 (n = 3 experimental replicates). pTVG4 = control plasmid vector not encoding SSX2. (B) Equimolar amounts of pTVG-SSX2 (30 µg) and MIP-SSX2 (24 µg) were administered to age-matched FVB mice (n = 3/group/time point) via tail vein injection. Livers were harvested on days 2, 7, and 14 and assayed for transgene expression using qRT-PCR. (* denotes a p-value < 0.05, two-sided t-test).

Figure 3. MIP immunization led to greater CD8+ T cell frequencies, but changes in cytokine secretion and elevated LAG3 expression on CD8+ T cells specific for the dominant epitope. HLA-A2/DRI mice (n = 6 per group) were immunized three times with either an empty vector control (pTVG4), or equimolar amounts of pTVG-SSX2 (100 µg) or MIP-SSX2 (83 µg). A) One week after the final immunization animals were euthanized and splenocytes were assayed for antigen-specific CD8+ responses by release of IFNγ, TNFα, or IL2 (panel A). (B) Averaged epitope-specific IFNγ (orange), TNFα (blue), or IL2 (violet) release for the two treatment groups over background levels. Diameter of the chart is proportional to the magnitude of total cytokine release. (C) Averaged proportions of epitope-specific polyfunctional CD8+ T cells. Diameter of the chart is proportional to the quantum of response, and each color is representative of the relative proportion of cells releasing either 1 (blue), 2 (red), or 3 (green) Th1 cytokines. (D) % of CD8+ T cells secreting at least 1 Th1 cytokine in response to either p41 or p103 restimulation that also expressed LAG3. (E) Frequencies of CD8+ T cells from animals receiving either pTVG-SSX2 or MIP-SSX2 immunizations that stained positive for p41 or p103 specific tetramers (left). Levels of LAG3 on p103 tetramer positive CD8+ T cells as measured by flow cytometry, with IgG fluorescent control MFI indicated by dotted line (right). These data are representative of three independent experiments. For all panels, * denotes a p-value < 0.05, two-sided t-test.
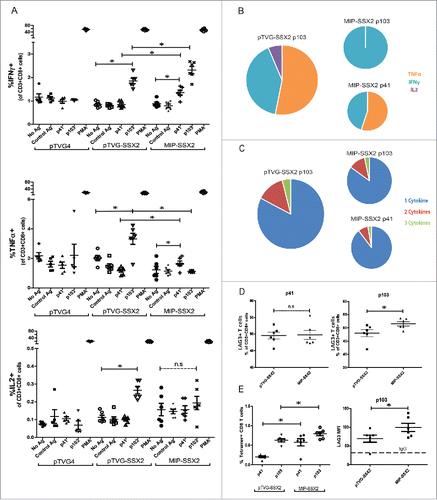
Figure 3. MIP immunization led to greater CD8+ T cell frequencies, but changes in cytokine secretion and elevated LAG3 expression on CD8+ T cells specific for the dominant epitope. HLA-A2/DRI mice (n = 6 per group) were immunized three times with either an empty vector control (pTVG4), or equimolar amounts of pTVG-SSX2 (100 µg) or MIP-SSX2 (83 µg). A) One week after the final immunization animals were euthanized and splenocytes were assayed for antigen-specific CD8+ responses by release of IFNγ, TNFα, or IL2 (panel A). (B) Averaged epitope-specific IFNγ (orange), TNFα (blue), or IL2 (violet) release for the two treatment groups over background levels. Diameter of the chart is proportional to the magnitude of total cytokine release. (C) Averaged proportions of epitope-specific polyfunctional CD8+ T cells. Diameter of the chart is proportional to the quantum of response, and each color is representative of the relative proportion of cells releasing either 1 (blue), 2 (red), or 3 (green) Th1 cytokines. (D) % of CD8+ T cells secreting at least 1 Th1 cytokine in response to either p41 or p103 restimulation that also expressed LAG3. (E) Frequencies of CD8+ T cells from animals receiving either pTVG-SSX2 or MIP-SSX2 immunizations that stained positive for p41 or p103 specific tetramers (left). Levels of LAG3 on p103 tetramer positive CD8+ T cells as measured by flow cytometry, with IgG fluorescent control MFI indicated by dotted line (right). These data are representative of three independent experiments. For all panels, * denotes a p-value < 0.05, two-sided t-test.

Figure 4. MIP-SSX2 immunization was inferior to standard plasmid DNA immunization as an antitumor therapy and resulted in elevated expression of LAG-3 on CD8+ tumor-infiltrating lymphocytes (TILs). A) HLA-A2/DR1 expressing mice were immunized four times bi-weekly (n = 6 per group) and subsequently challenged with a syngeneic sarcoma line engineered to overexpress SSX2. Tumor size was monitored over time (left). Splenocytes from tumor-challenged animals were analyzed for the frequency of SSX2-specific CD8+ T cells 35 d post tumor inoculation using tetramer staining specific for either p41 or p103 HLA-A2-restricted epitopes (right). (B) HLA-A2/DR1 expressing mice (n = 6–8 per group) were implanted with 5 × 10⁴ syngeneic sarcoma cells overexpressing SSX2. On days 1 and 15 post-tumor inoculation, mice were immunized with either an empty vector control (pTVG4), or equimolar amounts of pTVG-SSX2 (100 µg) or MIP-SSX2 (83 µg), and tumor growth was monitored over time. Shown are the average tumor sizes per treatment group (B), or tumor growth curves for individual animals over time in the individual pTVG-SSX2 or MIP-SSX2 treatment groups (C). (D) CD8+ tumor-infiltrating lymphocytes from these animals were analyzed for surface expression of LAG3, PD1, and TIM3 checkpoint markers. MFI = median fluorescence intensity. For all panels, * denotes a p-value < 0.05, two-sided t-test. Similar results were observed in three independent studies.
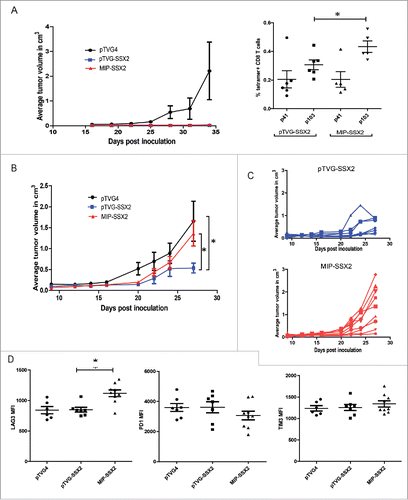
Figure 4. MIP-SSX2 immunization was inferior to standard plasmid DNA immunization as an antitumor therapy and resulted in elevated expression of LAG-3 on CD8+ tumor-infiltrating lymphocytes (TILs). A) HLA-A2/DR1 expressing mice were immunized four times bi-weekly (n = 6 per group) and subsequently challenged with a syngeneic sarcoma line engineered to overexpress SSX2. Tumor size was monitored over time (left). Splenocytes from tumor-challenged animals were analyzed for the frequency of SSX2-specific CD8+ T cells 35 d post tumor inoculation using tetramer staining specific for either p41 or p103 HLA-A2-restricted epitopes (right). (B) HLA-A2/DR1 expressing mice (n = 6–8 per group) were implanted with 5 × 10⁴ syngeneic sarcoma cells overexpressing SSX2. On days 1 and 15 post-tumor inoculation, mice were immunized with either an empty vector control (pTVG4), or equimolar amounts of pTVG-SSX2 (100 µg) or MIP-SSX2 (83 µg), and tumor growth was monitored over time. Shown are the average tumor sizes per treatment group (B), or tumor growth curves for individual animals over time in the individual pTVG-SSX2 or MIP-SSX2 treatment groups (C). (D) CD8+ tumor-infiltrating lymphocytes from these animals were analyzed for surface expression of LAG3, PD1, and TIM3 checkpoint markers. MFI = median fluorescence intensity. For all panels, * denotes a p-value < 0.05, two-sided t-test. Similar results were observed in three independent studies.

Figure 5. Antitumor effects of MIP-SSX2 immunization can be rescued by combination with anti-LAG3. (A) HLA-A2/DRI mice (n = 6 per group) were implanted with 5 × 10⁴ syngeneic sarcoma cells overexpressing SSX2. Starting one day post tumor inoculation, mice were immunized with either an empty vector control, or equimolar amounts of pTVG-SSX2 (100 µg) or MIP-SSX2 (83 µg) on days 1 and 15. Animals from each treatment group were then administered either anti-LAG3 (αLAG3, 200 µg on days 2,4,16, and 19, clone C9B7W) or PBS (vehicle) control, and tumor growth was monitored over time. (A) The average tumor size per treatment group. (B) Tumor growth curves for individual animals over time in the separate treatment groups. CR = complete tumor response. (C) Representative immunohistochemistry of tumor sections from the different treatment groups for CD8α (left). Ratio of CD3+CD4-CD8+ TILs to CD45- cells as assessed by flow cytometry (right) in each of the treatment groups. Data are representative of two independent experiments. For all panels, * denotes a p-value < 0.05, two-sided t-test.
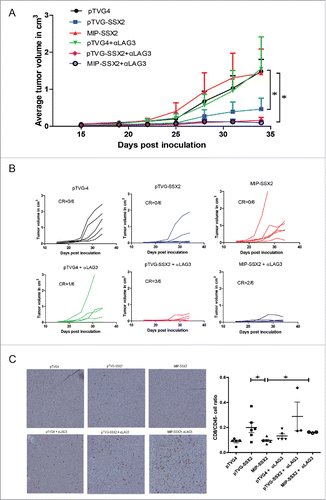
Figure 5. Antitumor effects of MIP-SSX2 immunization can be rescued by combination with anti-LAG3. (A) HLA-A2/DRI mice (n = 6 per group) were implanted with 5 × 10⁴ syngeneic sarcoma cells overexpressing SSX2. Starting one day post tumor inoculation, mice were immunized with either an empty vector control, or equimolar amounts of pTVG-SSX2 (100 µg) or MIP-SSX2 (83 µg) on days 1 and 15. Animals from each treatment group were then administered either anti-LAG3 (αLAG3, 200 µg on days 2,4,16, and 19, clone C9B7W) or PBS (vehicle) control, and tumor growth was monitored over time. (A) The average tumor size per treatment group. (B) Tumor growth curves for individual animals over time in the separate treatment groups. CR = complete tumor response. (C) Representative immunohistochemistry of tumor sections from the different treatment groups for CD8α (left). Ratio of CD3+CD4-CD8+ TILs to CD45- cells as assessed by flow cytometry (right) in each of the treatment groups. Data are representative of two independent experiments. For all panels, * denotes a p-value < 0.05, two-sided t-test.

Figure 6. LAG3 expression on CD8+ T cells is linked to antigen dose in vitro and in vivo. (A) B16 melanoma cells were transfected with either a suboptimal (2 µg) or optimal (5 µg) amount of a plasmid expressing chicken ovalbumin (psOVA). One day later, the cells were assayed for levels of OVA mRNA by qPCR (left). Culture supernatant from the transfected cells was used to stimulate OT1 splenocytes in vitro. Levels of LAG3 on the CD3+CD8+ splenocytes stimulated with the different supernatants was assayed 24 h later by flow cytometry (right). (B) OT1 splenocytes were stimulated with different amounts of SIINFEKL peptide and assayed for LAG3 expression 24 h later as above (representative data from three independent experiments). (C) 106 OT1 splenocytes were adoptively transferred into wild type C57BL6 mice (n = 5 per group), and then immunized with either 10 µg or 50 µg of psOVA. Three days later, LAG3 levels on SIINFEKL-specific tetramer+CD3+CD8+ CD44+ cells were assayed by flow cytometry. Given the absence of CD44+ tetramer+ cells in animals given vector control, LAG3 expression on cells from control animals is shown for all SIINFEKL tetramer positive CD8+ T cells. For all panels, * denotes a p-value < 0.05, two-sided t-test.
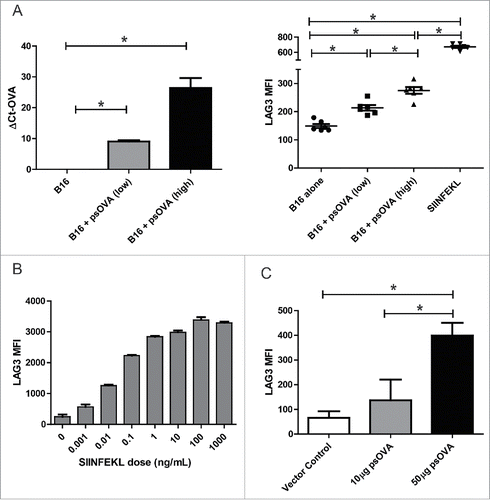
Figure 6. LAG3 expression on CD8+ T cells is linked to antigen dose in vitro and in vivo. (A) B16 melanoma cells were transfected with either a suboptimal (2 µg) or optimal (5 µg) amount of a plasmid expressing chicken ovalbumin (psOVA). One day later, the cells were assayed for levels of OVA mRNA by qPCR (left). Culture supernatant from the transfected cells was used to stimulate OT1 splenocytes in vitro. Levels of LAG3 on the CD3+CD8+ splenocytes stimulated with the different supernatants was assayed 24 h later by flow cytometry (right). (B) OT1 splenocytes were stimulated with different amounts of SIINFEKL peptide and assayed for LAG3 expression 24 h later as above (representative data from three independent experiments). (C) 106 OT1 splenocytes were adoptively transferred into wild type C57BL6 mice (n = 5 per group), and then immunized with either 10 µg or 50 µg of psOVA. Three days later, LAG3 levels on SIINFEKL-specific tetramer+CD3+CD8+ CD44+ cells were assayed by flow cytometry. Given the absence of CD44+ tetramer+ cells in animals given vector control, LAG3 expression on cells from control animals is shown for all SIINFEKL tetramer positive CD8+ T cells. For all panels, * denotes a p-value < 0.05, two-sided t-test.

Figure 7. LAG3 expression on CD8+ T cells increases with length of antigenic stimulation. (A) Transgenic OT1 splenocytes were stimulated for either 24 h or 72 h with a fixed concentration of SIINFEKL peptide and assayed for LAG3 expression on 4-1BB+ CD8+ T cells by flow cytometry at 72 h (data is representative of three independent experiments, with 5–10 independent samples each). (B) Transgenic OT1 splenocytes were adoptively transferred into wild-type C57BL6 mice (n = 4 to 5 animals per group) and administered a priming immunization of SIINFEKL peptide (100 µg) and pTVG4 (50 µg) 24 h later. Four days after priming, animals were divided into groups and boosted with either PBS, SIINFEKL peptide (100 µg), or SIINFEKL peptide (100 µg) and pTVG4 (50µg). Two days after the booster immunization, levels of LAG3 were assayed on SIINFEKL tetramer+ CD8+ T cells from the spleens of treated mice by flow cytometry. (C) Transgenic OT1 splenocytes were stimulated with either SIINFEKL, EIINFEKL, or SIIGFEKL peptides at 2 µg/mL for 24 h and assayed for LAG3 expression by flow cytometry on CD8+ T cells. For all panels, * denotes a p-value < 0.05, two-sided t-test.

Figure 7. LAG3 expression on CD8+ T cells increases with length of antigenic stimulation. (A) Transgenic OT1 splenocytes were stimulated for either 24 h or 72 h with a fixed concentration of SIINFEKL peptide and assayed for LAG3 expression on 4-1BB+ CD8+ T cells by flow cytometry at 72 h (data is representative of three independent experiments, with 5–10 independent samples each). (B) Transgenic OT1 splenocytes were adoptively transferred into wild-type C57BL6 mice (n = 4 to 5 animals per group) and administered a priming immunization of SIINFEKL peptide (100 µg) and pTVG4 (50 µg) 24 h later. Four days after priming, animals were divided into groups and boosted with either PBS, SIINFEKL peptide (100 µg), or SIINFEKL peptide (100 µg) and pTVG4 (50µg). Two days after the booster immunization, levels of LAG3 were assayed on SIINFEKL tetramer+ CD8+ T cells from the spleens of treated mice by flow cytometry. (C) Transgenic OT1 splenocytes were stimulated with either SIINFEKL, EIINFEKL, or SIIGFEKL peptides at 2 µg/mL for 24 h and assayed for LAG3 expression by flow cytometry on CD8+ T cells. For all panels, * denotes a p-value < 0.05, two-sided t-test.

Figure 8. Model: Increased antigen dose and duration of presentation lead to increased LAG3 expression and a tolerogenic phenotype. (A) Traditional model in which LAG3 expression is transient with vaccination, and increases with high antigen dose. Addition of an appropriate adjuvant may reduce the initial upregulation of LAG3. (B) Vaccination schemes that mediate persistent expression of antigen in a non-inflammatory environment (such as mini-intronic plasmids) result in sustained LAG3 expression on CD8+ T cells, which is in turn associated with loss of effector function and a tolerant phenotype.
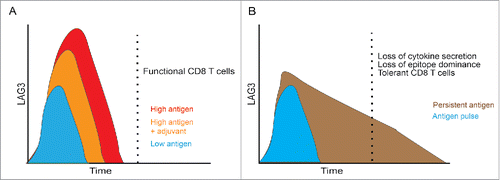
Figure 8. Model: Increased antigen dose and duration of presentation lead to increased LAG3 expression and a tolerogenic phenotype. (A) Traditional model in which LAG3 expression is transient with vaccination, and increases with high antigen dose. Addition of an appropriate adjuvant may reduce the initial upregulation of LAG3. (B) Vaccination schemes that mediate persistent expression of antigen in a non-inflammatory environment (such as mini-intronic plasmids) result in sustained LAG3 expression on CD8+ T cells, which is in turn associated with loss of effector function and a tolerant phenotype.
Supplemental material

KONI_A_1223002_s02.pdf

Download PDF (1.6 MB)

Reprints and Corporate Permissions

Please note: Selecting permissions does not provide access to the full text of the article, please see our help page How do I view content?

To request a reprint or corporate permissions for this article, please click on the relevant link below:

Academic Permissions

Please note: Selecting permissions does not provide access to the full text of the article, please see our help page How do I view content?

Obtain permissions instantly via Rightslink by clicking on the button below:

If you are unable to obtain permissions via Rightslink, please complete and submit this Permissions form. For more information, please visit our Permissions help page.