
Figures & data
Figure 1. TIM-3 is highly expressed in both CD8+ and CD8+GrzB+tumor-infiltrating T cells in FL lymph nodes. Percentage of CD3+CD8+TIM-3+ T cells (A) and TIM-3 median fluorescence intensity (B) in CD3+CD8+ T cells from FL nodes (n = 33) and tonsils (n = 29). Percentage of CD3+CD8+GrzB+TIM-3+ T cells (C) and TIM-3 median fluorescence intensity in TIM-3+ CTL cells (D) in FL nodes and tonsils. Example of the gating strategy used and representative histogram of TIM-3 expression in CD8+GrzB+ in FL lymph nodes (E) and in tonsils (F). Unpaired Student's t-test using the GraphPad Prism software (version 6; GraphPad) was used to determine the statistical significance of differences between the groups. p = 0.0002 (A); p = 0.0164 (B); p = 0.0015 (C); p = 0.0078 (D).
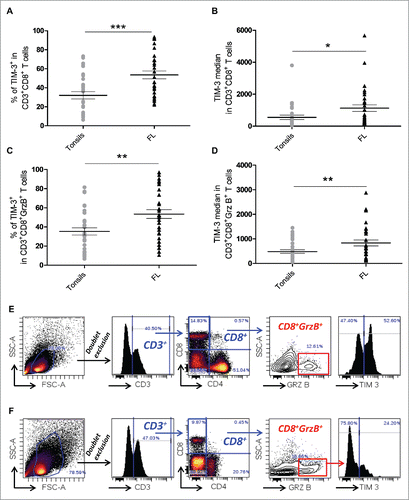
Figure 2. Impact of TIM-3 expression on cytokine production and lytic machinery activation in FL lymph node CD8+ T cells following TCR triggering. IFNγ (A) and TNFα (B) production by CD8+TIM-3+or by CD8+TIM-3− T cells from FL lymph node cell suspensions (n = 26) after 4 h conjugation with unpulsed or SAg-pulsed EBV B cells. CD107a exposure (C) and GrzB expression (D) in CD8+TIM-3+or CD8+TIM-3− T cells in FL cell suspensions after conjugation. Wilcoxon signed-rank test using the GraphPad Prism software (version 6; GraphPad) was used to determine the statistical significance of differences between the groups. p = 0.0206, 0.0012, 0.0027 (A); p = 0.0252, 0.0002, 0.0261 (B); p = 0.0332, 0.0206, 0.0002 (C); p = 0.3301, 0.3684, 0.0853 (D).
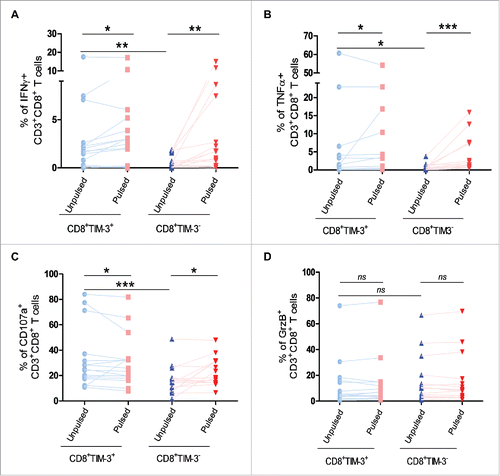
Figure 3. Minor alteration of immunological synapse formation in CD8+TIM-3+ T cells from FL lymph nodes. Representative IS formation between CD8+TIM–3+ T cells (A) and CD8+TIM-3– T cells (B and C) from FL lymph nodes (n = 3) stained with α-tubulin (green) and pTyr (red) after 15 min conjugation with unpulsed (C) or SAg-pulsed (A and B) EBV B cells (blue stained). The yellow arrow indicates the MTOC position. Bar 5 µm. (D) Scheme depicting pTyr intensity measurement defined by three reference areas at different regions of the T cell surface: immunological synapse between T cell and target B cell (=IS), distal synapse region (=D–IS) and area between these two regions (=M). The intensity of pTyr red fluorescence was measured in the different cell areas as indicated in the scheme. Fluorescence intensity in the regions of interest was compared to that of the entire cells using the Metamorph® software. In particular, the mean intensity of pTyr red fluorescence in CD8+TIM-3– and in CD8+TIM3+ T cells was calculated by dividing the pTyr red pixels in IS and those in the D-IS for the total red pixel of entire cell (IS+M+D-IS) (E). Comparison of pTyr staining lenght at the IS area between pulsed CD8+TIM-3+ T cells and CD8+TIM-3– T cells (unpulsed CD8+TIM-3– T cells as negative control) (µm). (F) Comparison of the distance between microtubule-organizing center (MTOC) and the center of the IS area between pulsed CD8+TIM-3+ T cells and CD8+TIM-3– T cells (µm). Each dot in represents a cell. Data are from three FL patients. For the different FL samples standardized conditions for pinhole size, for gain and offset (brightness and contrast), were used for image capture. Wilcoxon signed-rank test using the GraphPad Prism software (version 6; GraphPad) was used to determine the statistical significance of differences between the groups. p = 0.3699, p < 0.0001, and p < 0.0001, respectively (D); p < 0.0001 and p = 0.0232, respectively (E).
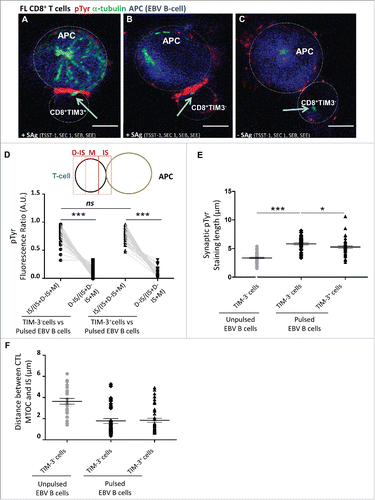
Figure 4. Selective signaling defects following FL CD8+ TIM-3+ T cell stimulation. Representative histogram overlay (A) and pooled datas (B) of CD8+TIM-3+ and CD8+TIM-3−T cells staining for phosphorylated ERK (pERK) and AKT (T308 and S473) (pAKTs), (MFI), after 15 min of PMA/ion stimulation (n = 7). Representative histogram overlay (C) and pooled datas (D) of CD8+TIM-3+ and CD8+ TIM-3− T cell staining for pERK after 15 min of TCR triggering (n = 4). Paired Student's t-test using the GraphPad Prism software (version 6; GraphPad) was used to determine the statistical significance of differences between the groups. p = 0.0488 (B); p = 0.0422 (D).
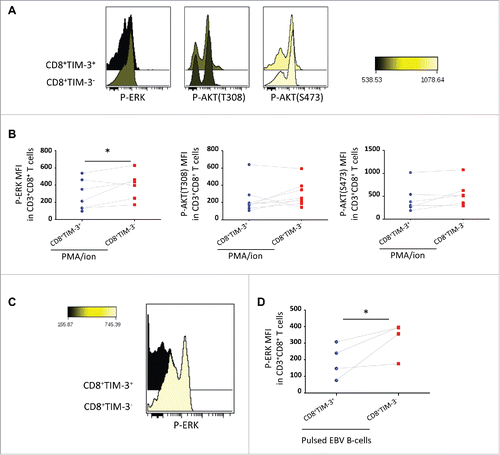
Figure 5. Correlation of TIM-3 expression in FL microenvironment with progression-free-survival in FL patients treated by R-combined chemotherapy. Representative sections from FL lymph nodes showing high (A and B) and low (C and D) content of TIM-3+ cells, with cutoff of 10% (bar = 50 µm). Kaplan Meier curves for PFS of FL patients (n = 46) according to GrzB score ( p = 0.016) (E); to the percentage of TIM-3+ cells (p = 0.037) (F) and to the cumulative value of GrzB score and TIM-3 staining in the four groups (Log rank p-value = 0.0064) (G).
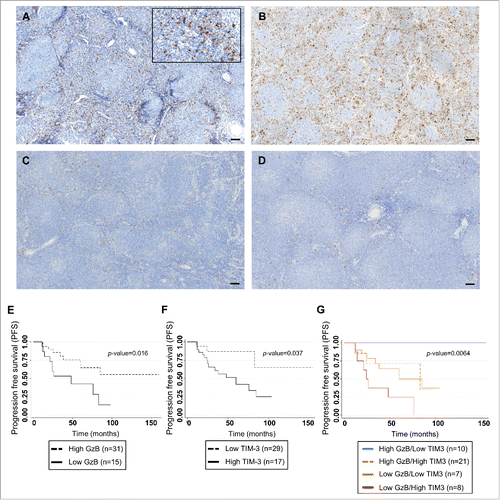
Table 1. Clinical features and IHC score for TIM-3 staining of the 46 FL patients cohort.
Table 2. Clinical features and progression-free survival of the 46 FL patients used for IHC.