Figures & data
Figure 1. Characterization of GUCY2C-specific antibodies and CAR constructs. (A) Monoclonal antibodies generated against GUCY2C (MS7, MS20, and MS24) were assessed by ELISA for specific binding to GUCY2CECD or negative control bovine serum albumin (BSA) plated at 1 μg/mL, ****p < 0.0001 (Two-way ANOVA of GUCY2C vs. BSA – binding for each mAb). (B) Wild-type (Gucy2c+/+) or GUCY2C-deficient (Gucy2c−/−) mouse colon sections were stained with GUCY2C-specific monoclonal antibodies (green), demonstrating specificity of antibodies for GUCY2C in the intestine. DAPI (blue). Representative of three sections each. (C) Flow cytometry analysis was performed on GUCY2C-deficient (CT26) and GUCY2C-expressing (CT26.GUCY2C) CT26 mouse colorectal cancer cells stained with GUCY2C mAbs. Results are representative of two experiments. (D) A third generation CAR construct was synthesized containing the BiP signal sequence, scFv, the CD8α hinge region, the transmembrane and intracellular domain of CD28, the intracellular domain of 4-1BB (CD137) and the intracellular domain of CD3ζ. The CAR construct was inserted into the MSCV retroviral plasmid pMIG upstream of an IRES-GFP marker. (D) Murine CD8+ T cells transduced with a retrovirus containing a Control CAR or CARs derived from GUCY2C antibodies (MS7 and MS24) were labeled with varying concentrations of purified 6xHis-GUCY2CECD (0–10 μM) detected with α5xHis-Alexa-647 conjugate. Flow plots (Fig. S3) were gated on live CD8+ cells and the mean fluorescence intensity (MFI) indicated 6xHis-GUCY2CECD binding on live CD8+ transduced (GFP+) cells. MS7 and MS24 binding curves were compared by extra-sum-of-squares F test. Data represent mean ± standard deviation of three experiments.
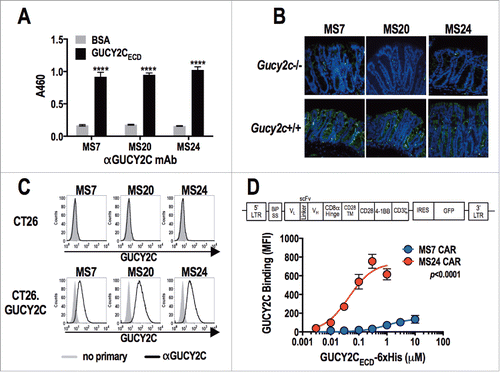
Figure 2. GUCY2C-specific CARs mediate antigen-dependent T cell activation. 1 × 10⁶ CAR-expressing T cells were stimulated for 6 h with plate-coated antigen (BSA or GUCY2C) or PMA and Ionomycin (PMA/IONO). T cell activation markers CD25 (A) and CD69 (B) were quantified by flow cytometry. Histograms are gated on live CD8+GFP+ T cells. Results are representative of three experiments.
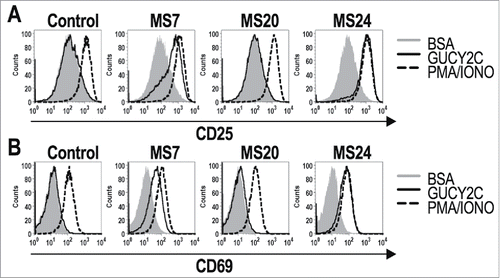
Figure 3. GUCY2C-specific CARs mediate cytokine production. 1 × 10⁶ CAR-expressing T cells were stimulated for 6 h with plate-coated antigen (BSA or GUCY2C) or PMA and Ionomycin (PMA/IONO) in the presence of protein transport inhibitor. Cells were fixed, permeabilized, and stained for the intracellular cytokines IFNγ, TNFα, or MIP-1α and analyzed via flow cytometry. (A) Plots are gated on live GFP- (top) or GFP+ (bottom) CD8+ T cells. (B) Polyfunctional cytokine graphs depict the percentages of CAR-T cells producing 0, 1, 2, or 3 cytokines. Plots in (A) are representative of two experiments, and polyfunctional cytokine analysis (B) represent means ± standard deviation of two experiments.
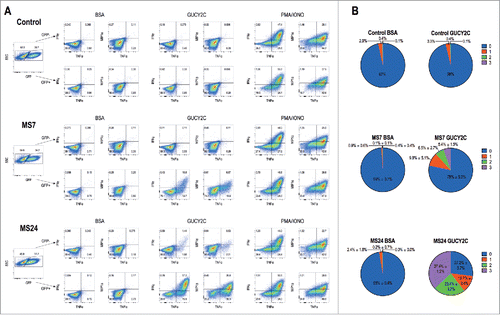
Figure 4. Real-time GUCY2C-specific CAR T cell-mediated cytotoxicity. CT26 (A and C) or CT26.GUCY2C (B and D) mouse colorectal cancer cells were seeded at 10,000 cells/well in an E-Plate and CAR-T cells, media, or Triton-X 100 (Triton) were added to the plate 24 h later (time = 0). The E-Plate was scanned every 15 min to quantify relative electrical impedance (normalized to time = 0). (A and B) Solid lines indicate the mean of duplicate wells and surrounding clouds indicate standard deviation. Results are representative of two experiments. (C and D) % specific lysis values for each CAR-T cell and target cell combination were calculated from the impedance data at the indicated time points. All statistical tests in (C) and (D) compared (1) Control to MS7, (2) Control to MS24, and (3) MS7 to MS24 (**p < 0.01, ****p < 0.0001, Two-way ANOVA). (C and D) show the means ± standard deviation of two experiments.
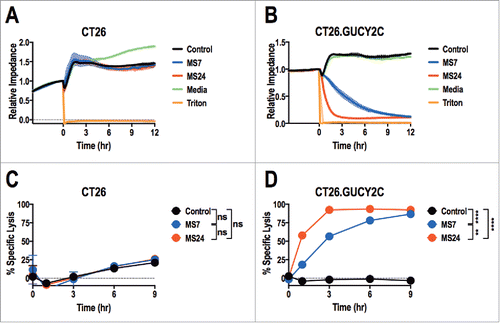
Figure 5. GUCY2C-specific CAR T cells oppose parenchymal colorectal cancer metastases. (A–D) BALB/c mice were injected i.v. with 5 × 10⁵ CT26.GUCY2C cells to establish lung metastases. On day 3, mice received a dose of 5 Gy TBI followed by an i.v. injection of ˜1 × 10⁷ CAR-T cells. Mice were sacrificed on day 24 after tumor inoculation, lungs were stained with India ink, and tumor nodules were counted (A and B), or mice were followed longitudinally for morbidity (C) and survival (D). (A) Representative images of lungs collected and stained on day 24. (B) Quantification of metastases in each mouse. (N = 8–9 mice/group; *p < 0.05, **p < 0.01, and ****p < 0.0001, One-way ANOVA). (C) Body weight curves of mice relative to initial body weight indicating progression of cancer cachexia, where each line represents an individual mouse. No Tumor represents curves of unmanipulated mice. (n = 10–13 mice/group; ns = not significant, ** p< 0.01, *** p< 0.001, One-way ANOVA of total area under the curve). (D) Survival analysis (n = 10–13 mice/group; ****p < 0.0001, Mantel-Cox log-rank test). All statistical tests in (B–D) compared (1) Control to MS7, (2) Control to MS24, and (3) MS7 to MS24.
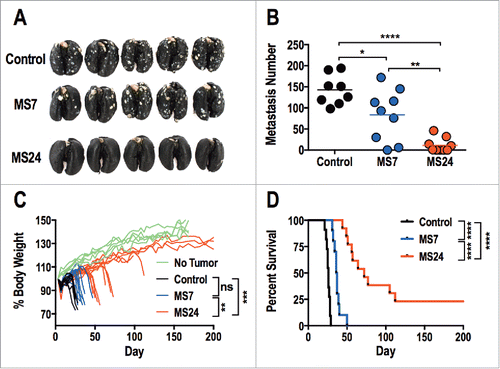
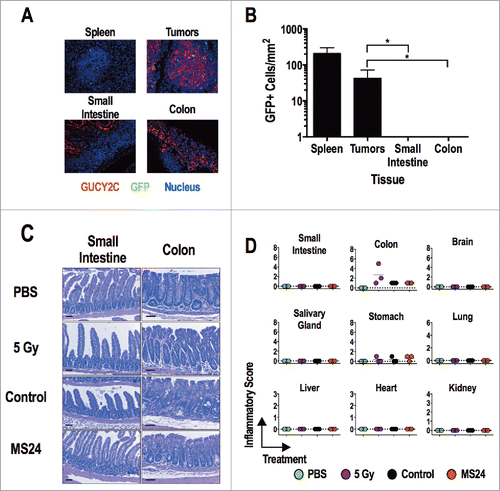
Figure 6. GUCY2C-specific CAR T cells do not induce tissue damage. (A and B) MS24 CAR-T cells were administered to BALB/c mice with CT26.GUCY2C lung metastases established 14 d earlier following 5 Gy TBI. (A) Lungs, spleens, and intestines were collected 2 d later, and tissue sections were stained with anti-GUCY2C (red) and anti-GFP (green) antibodies and counterstained with DAPI. (B) GFP+ MS24 CAR-T cells were quantified in remnant follicles in spleen, tumor metastases in lungs, and Peyer's patches in intestines by immunostaining of GFP. Data represent the mean of four mice. (****p < 0.001, One-way ANOVA compared to accumulation in lung metastases). (C and D) BALB/c mice were treated with PBS, 5 Gy TBI, 5 Gy TBI + 1 × 10⁷ Control or MS24 CAR-T cells. On day 6 post-treatment, mice were sacrificed and tissues collected, fixed in formalin, and paraffin embedded. Slides were stained with H&E and scored for pathology. Scale bars indicate 100 μm. (C) Representative H&E-stained small intestine and colon sections. (D) Inflammatory scoring for all tissues collected. No significant differences between Control and MS24 CAR-T cell treatment groups were detected (One-way ANOVA).