5,626
Views
58
CrossRef citations to date
0
Altmetric
Original Research

Overcoming resistance to HER2-targeted therapy with a novel HER2/CD3 bispecific antibody

, , , , , , , , , & ORCID Icon show all
Article: e1267891 | Received 31 Aug 2016, Accepted 24 Nov 2016, Published online: 30 Mar 2017

Figures & data

Figure 1. In vitro characterization of HER2-BsAb. (A) HER2-BsAb has the same specificity as trastuzumab. Pre-Incubation of the HER2(+)high SKOV3 cells with trastuzumab prevents HER2-BsAb binding. (B) HER2-BsAb and trastuzumab have similar avidity for SKOV3 cells. MFI was plotted against the antibody concentration. (C) HER2-BsAb maintained same anti-proliferative effects as trastuzumab against the trastuzumab-sensitive SKBR3 cells. (D) HER2-BsAb mediates T cell cytotoxicity against the HER2(+)MCF-7 cells but not the HER2(−) HTB-132 cells. (E) Blocking of HER2 or CD3 by trastuzumab or huOKT3, abrogates HER2-BsAb T-cell cytotoxicity. HER2(+) SCCHN PCI-13 cells were used in the cytotoxicity assay. For this experiment, 0.1 ug/mL of HER2-BsAb with 10 ug/mL of the blocking antibodies was used.
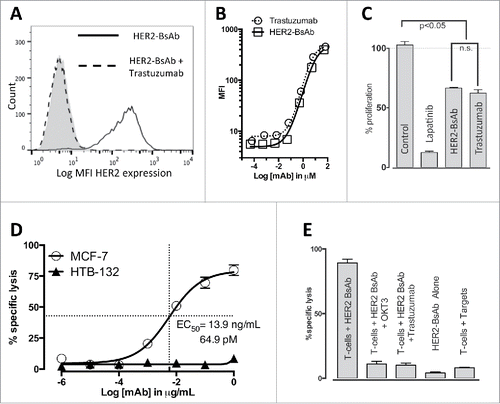
Figure 1. In vitro characterization of HER2-BsAb. (A) HER2-BsAb has the same specificity as trastuzumab. Pre-Incubation of the HER2(+)high SKOV3 cells with trastuzumab prevents HER2-BsAb binding. (B) HER2-BsAb and trastuzumab have similar avidity for SKOV3 cells. MFI was plotted against the antibody concentration. (C) HER2-BsAb maintained same anti-proliferative effects as trastuzumab against the trastuzumab-sensitive SKBR3 cells. (D) HER2-BsAb mediates T cell cytotoxicity against the HER2(+)MCF-7 cells but not the HER2(−) HTB-132 cells. (E) Blocking of HER2 or CD3 by trastuzumab or huOKT3, abrogates HER2-BsAb T-cell cytotoxicity. HER2(+) SCCHN PCI-13 cells were used in the cytotoxicity assay. For this experiment, 0.1 ug/mL of HER2-BsAb with 10 ug/mL of the blocking antibodies was used.

Table 1. HER2 Expression and EC50 in the presence of ATC and HER2-BsAb in 39 different cell lines from different tumor systems.

Figure 2. HER2-BsAb mediates cytotoxic responses against carcinoma cell lines resistant to other HER-targeted therapies. Three representative cell lines were used for FACS assay (upper panel), proliferation assay (middle panel) and HER2-BsAb-mediated CTL assay (lower panel): (A) SCCHN PCI-30, (B) breast carcinoma HCC-1954 and (C) osteosarcoma U2OS. (D) HER2-BsAb EC50 inversely correlates with level of HER2 expression. Each of the cell lines used in a cytotoxicity assay () was assayed at least twice. The EC50 was determined each time and averaged. These values (except those beyond assay limit 5 nM) were compared with HER2 expression (MFI).
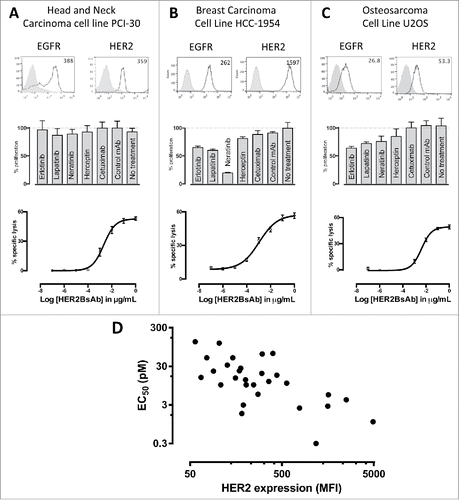
Figure 2. HER2-BsAb mediates cytotoxic responses against carcinoma cell lines resistant to other HER-targeted therapies. Three representative cell lines were used for FACS assay (upper panel), proliferation assay (middle panel) and HER2-BsAb-mediated CTL assay (lower panel): (A) SCCHN PCI-30, (B) breast carcinoma HCC-1954 and (C) osteosarcoma U2OS. (D) HER2-BsAb EC50 inversely correlates with level of HER2 expression. Each of the cell lines used in a cytotoxicity assay (Table 1) was assayed at least twice. The EC50 was determined each time and averaged. These values (except those beyond assay limit 5 nM) were compared with HER2 expression (MFI).

Figure 3. HER2-BsAb-mediated in vitro T cell cytotoxicity was relatively insensitive to PD-L1 expression on the tumor targets or PD-1 expression on T cells. (A) FACS analysis of PD-L1 expression in HCC1954 cells (left panel), of induced PD-1 expression in ATCs (middle panel), and HER2-BsAb-mediated cytotoxicity (right panel). (B) FACS analysis of PD-L1 expression in HEK-293 cells (left panel), and HER2-BsAb-mediated cytotoxicity using the ATCs as in (A) (middle panel). Mean + SEM (n = 6).
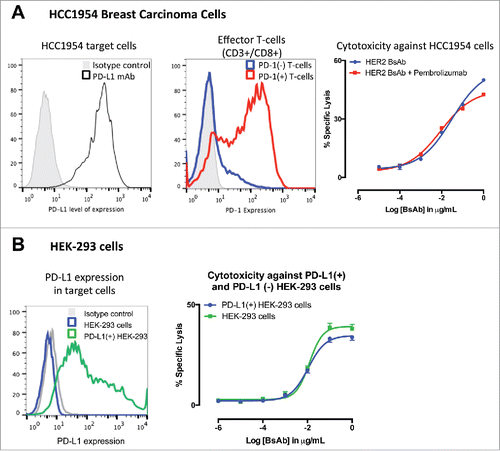
Figure 3. HER2-BsAb-mediated in vitro T cell cytotoxicity was relatively insensitive to PD-L1 expression on the tumor targets or PD-1 expression on T cells. (A) FACS analysis of PD-L1 expression in HCC1954 cells (left panel), of induced PD-1 expression in ATCs (middle panel), and HER2-BsAb-mediated cytotoxicity (right panel). (B) FACS analysis of PD-L1 expression in HEK-293 cells (left panel), and HER2-BsAb-mediated cytotoxicity using the ATCs as in (A) (middle panel). Mean + SEM (n = 6).

Figure 4. HER2-BsAb is effective against HER2(+) breast cancer cell line xenografts. Treatment schedules were marked on the figures, and doses of BsAbs and effector cells were detailed in the Results. Data shown as mean + SEM (n = 5). (A) iv tumor plus iv effector cells model: Bioluminescence changes of MCF7 breast cancers during treatment. (B, C) sc tumor plus sc effector cells (mixing) model: % tumor growth of MCF7 (B), and tumor volume changes of HCC1954 (C). (D) sc tumor plus iv effector cells model: tumor volume changes of HCC1954. (E) HCC1954 sc tumor model as in (D), with treatments of one dose of PBMC (2×10⁷ cells iv) at day 14, and two doses of BsAbs (100 ug iv) at day 12 and 15. Representative images (200× magnifications) of IHC staining of tumor sections collected 5 d after iv PBMC were shown.
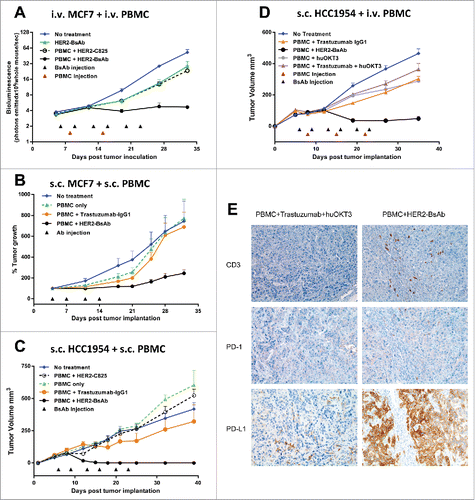
Figure 4. HER2-BsAb is effective against HER2(+) breast cancer cell line xenografts. Treatment schedules were marked on the figures, and doses of BsAbs and effector cells were detailed in the Results. Data shown as mean + SEM (n = 5). (A) iv tumor plus iv effector cells model: Bioluminescence changes of MCF7 breast cancers during treatment. (B, C) sc tumor plus sc effector cells (mixing) model: % tumor growth of MCF7 (B), and tumor volume changes of HCC1954 (C). (D) sc tumor plus iv effector cells model: tumor volume changes of HCC1954. (E) HCC1954 sc tumor model as in (D), with treatments of one dose of PBMC (2×10⁷ cells iv) at day 14, and two doses of BsAbs (100 ug iv) at day 12 and 15. Representative images (200× magnifications) of IHC staining of tumor sections collected 5 d after iv PBMC were shown.

Figure 5. HER2-BsAb is effective against HER2(+) ovarian cancer cell line xenografts. Treatment schedules were marked on the figures, and doses of BsAbs and effector cells were detailed in the Results. Data shown as mean + SEM (n = 4). (A) ip tumor plus ip/iv effector cells model: Bioluminescence changes of SKOV3-luc ovarian cancers during treatment. (B) Representative bioluminescence images at the beginning (Day 13) and ending (Day 34) of the treatment were shown.
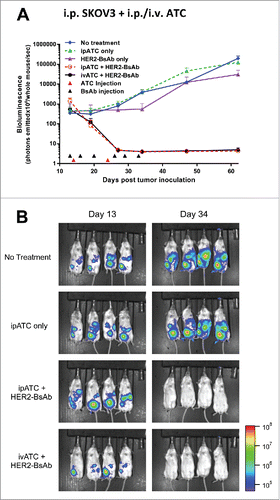
Figure 5. HER2-BsAb is effective against HER2(+) ovarian cancer cell line xenografts. Treatment schedules were marked on the figures, and doses of BsAbs and effector cells were detailed in the Results. Data shown as mean + SEM (n = 4). (A) ip tumor plus ip/iv effector cells model: Bioluminescence changes of SKOV3-luc ovarian cancers during treatment. (B) Representative bioluminescence images at the beginning (Day 13) and ending (Day 34) of the treatment were shown.

Figure 6. HER2-BsAb is effective against HER2(+) PDXs. sc tumor plus iv effector cells model was used for PDXs. Treatment schedules were marked on the figures, and doses of BsAbs and effector cells were detailed in the Results. Data shown as mean + SEM (n = 5). (A) Tumor volume changes of EK gastric cancer PDX. (B) IHC images of CD3 staining from another experiment with similar setting as in (A). Representative images (200× magnifications) of IHC staining of tumor sections collected 36 d after iv PBMC were shown. (C) IHC images (200× magnifications) of HER2 staining of control treated tumor sections. (D, E) Average tumor volume changes of M37 breast cancer PDX (D), and tumor growth of five individual mouse (black thin line) and averages (red thick line) in each group (E).
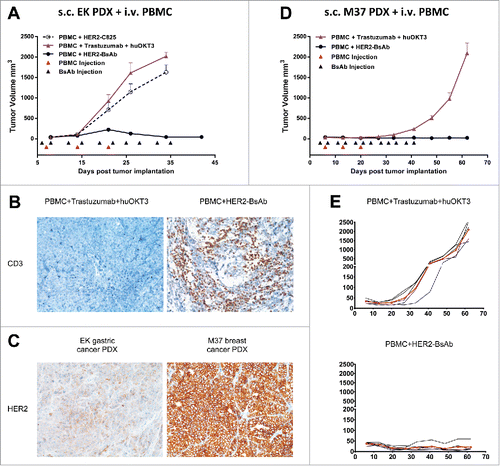
Figure 6. HER2-BsAb is effective against HER2(+) PDXs. sc tumor plus iv effector cells model was used for PDXs. Treatment schedules were marked on the figures, and doses of BsAbs and effector cells were detailed in the Results. Data shown as mean + SEM (n = 5). (A) Tumor volume changes of EK gastric cancer PDX. (B) IHC images of CD3 staining from another experiment with similar setting as in (A). Representative images (200× magnifications) of IHC staining of tumor sections collected 36 d after iv PBMC were shown. (C) IHC images (200× magnifications) of HER2 staining of control treated tumor sections. (D, E) Average tumor volume changes of M37 breast cancer PDX (D), and tumor growth of five individual mouse (black thin line) and averages (red thick line) in each group (E).
Supplemental material

KONI_A_1267891_s02.pdf

Download PDF (223.5 KB)