3,644
Views
103
CrossRef citations to date
0
Altmetric
Original Research

JAK-STAT-mediated chronic inflammation impairs cytotoxic T lymphocyte activation to decrease anti-PD-1 immunotherapy efficacy in pancreatic cancer

, , , &
Article: e1291106 | Received 17 Oct 2016, Accepted 31 Jan 2017, Published online: 30 Mar 2017

Figures & data

Figure 1. Ruxolitinib inhibits STAT1 and STAT3 activation to suppress pancreatic tumor growth in vivo. (A) Scheme of the orthotopic PANC02-H7 pancreatic tumor mouse model and Ruxolitinib (Rux) therapy. PANC02-H7 cells were injected into pancreas of mice. Tumor-bearing mice were treated with Ruxolitinib (50 mg/kg body weight) daily starting on day 6 for 10 d. (B) The orthotopic tumors were dissected from control (n = 4) and Ruxolitinib-treated (n = 4) tumor-bearing mice 15 d after tumor transplant. Shown are the images of the dissected tumors. Bottom panel: tumors were measured using a digital caliber. The tumor volume was calculated by the formula of length × width2/2 (left panel). Tumor weights of the control and treatment groups are presented at the right. (C) Tumor tissues were homogenized in total protein lysis buffer and analyzed by Western blotting using the indicated antibodies. β-actin was used as normalization control. (D) The protein band intensities of pSTAT1, pSTAT2, pSTAT3, pSTAT5, and pSTAT6 as shown in (C) were quantified using NIH image J and normalized as the ratios of each over the intensities of β-actin. Column: Mean of three mice; Bar: SD. **p < 0.01.
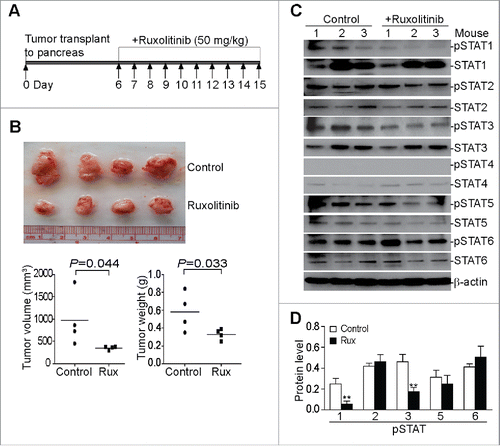
Figure 1. Ruxolitinib inhibits STAT1 and STAT3 activation to suppress pancreatic tumor growth in vivo. (A) Scheme of the orthotopic PANC02-H7 pancreatic tumor mouse model and Ruxolitinib (Rux) therapy. PANC02-H7 cells were injected into pancreas of mice. Tumor-bearing mice were treated with Ruxolitinib (50 mg/kg body weight) daily starting on day 6 for 10 d. (B) The orthotopic tumors were dissected from control (n = 4) and Ruxolitinib-treated (n = 4) tumor-bearing mice 15 d after tumor transplant. Shown are the images of the dissected tumors. Bottom panel: tumors were measured using a digital caliber. The tumor volume was calculated by the formula of length × width2/2 (left panel). Tumor weights of the control and treatment groups are presented at the right. (C) Tumor tissues were homogenized in total protein lysis buffer and analyzed by Western blotting using the indicated antibodies. β-actin was used as normalization control. (D) The protein band intensities of pSTAT1, pSTAT2, pSTAT3, pSTAT5, and pSTAT6 as shown in (C) were quantified using NIH image J and normalized as the ratios of each over the intensities of β-actin. Column: Mean of three mice; Bar: SD. **p < 0.01.

Figure 2. Ruxolitinib-mediated tumor suppression depends on host T cells in vivo. (A) PANC02-H7 cells were transplanted to the pancreas of Rag1 KO mice. Five days later, the tumor-bearing mice were treated with solvent (control, n = 5) or Ruxolitinib (n = 5) daily for 10 d. The orthotopic tumors were dissected from tumor-bearing mice 15 d after tumor transplant. Shown are images of the dissected tumors. Tumors were measured using a digital caliber. The tumor volume was calculated by the formula of length × width2/2 and presented at the left panel. Tumor weights of the control and treatment group are presented at the right panel. (B) Tumor tissues from control (n = 4) and Ruxolitinib-treated (n = 4) tumor-bearing mice were dissected 15 d after tumor transplant as in (A) and analyzed by real-time PCR to determine the levels of Th1/Tc1 cell markers, immune checkpoint molecules, T cells and T cell effector molecules, Th9, Th17 cell markers, T cell chemoattractants and type I interferons using the indicated gene-specific PCR primers. Column: Mean; Bar: SD. (C) RNAs were isolated from normal pancreas (n = 5) and orthotopic pancreatic tumor tissues (n = 5) and analyzed by real-time PCR for interferons and T cell chemoattractants using the indicated gene-specific PCR primers. (D) Tumor tissues from control (n = 4) and Ruxolitinib-treated (n = 4) tumor-bearing mice were dissected 15 d after tumor transplant as in A to be prepared for single cells. The cells were stained with fluorescent-conjugated anti-mouse CD8α mAb and analyzed by flow cytometry. Top panels show percentage of CD8+ cells in the tumor tissues of one representative mouse of the control and the ruxolitinib-treated tumor-bearing mice, respectively. Bottom panel: quantification of % CD8+ T cells in the tumor tissues.
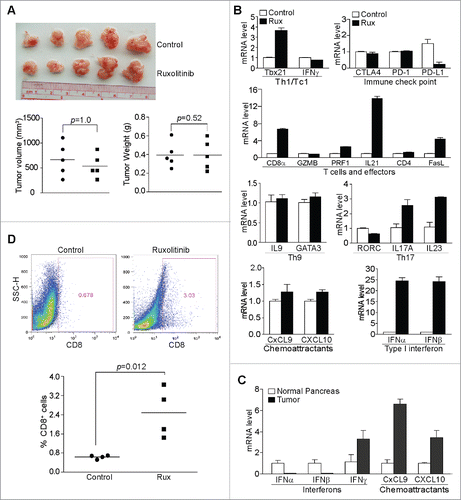
Figure 2. Ruxolitinib-mediated tumor suppression depends on host T cells in vivo. (A) PANC02-H7 cells were transplanted to the pancreas of Rag1 KO mice. Five days later, the tumor-bearing mice were treated with solvent (control, n = 5) or Ruxolitinib (n = 5) daily for 10 d. The orthotopic tumors were dissected from tumor-bearing mice 15 d after tumor transplant. Shown are images of the dissected tumors. Tumors were measured using a digital caliber. The tumor volume was calculated by the formula of length × width2/2 and presented at the left panel. Tumor weights of the control and treatment group are presented at the right panel. (B) Tumor tissues from control (n = 4) and Ruxolitinib-treated (n = 4) tumor-bearing mice were dissected 15 d after tumor transplant as in (A) and analyzed by real-time PCR to determine the levels of Th1/Tc1 cell markers, immune checkpoint molecules, T cells and T cell effector molecules, Th9, Th17 cell markers, T cell chemoattractants and type I interferons using the indicated gene-specific PCR primers. Column: Mean; Bar: SD. (C) RNAs were isolated from normal pancreas (n = 5) and orthotopic pancreatic tumor tissues (n = 5) and analyzed by real-time PCR for interferons and T cell chemoattractants using the indicated gene-specific PCR primers. (D) Tumor tissues from control (n = 4) and Ruxolitinib-treated (n = 4) tumor-bearing mice were dissected 15 d after tumor transplant as in A to be prepared for single cells. The cells were stained with fluorescent-conjugated anti-mouse CD8α mAb and analyzed by flow cytometry. Top panels show percentage of CD8+ cells in the tumor tissues of one representative mouse of the control and the ruxolitinib-treated tumor-bearing mice, respectively. Bottom panel: quantification of % CD8+ T cells in the tumor tissues.

Figure 3. IFNγ is essential for suppression of pancreatic cancer growth in vivo. (A) Tumor cells were transplanted to pancreas of WT (n = 5) and IFNγ KO (n = 5) mice. The orthotopic tumors were dissected from tumor-bearing mice 15 d after tumor transplant. Shown are images of the dissected tumors from one of the two experiments. Tumors from WT (n = 10) and IFNγ KO (n = 10) mice from two experiments were weighed and measured and presented at the bottom panel. (B) Tumor tissues from WT (n = 5) and IFNγ KO (n = 5) mice from one of the two experiments were digested to make single cells and stained with fluorescent dye-conjugated anti-mouse PD-L1 mAb. Shown are the overlay of representative plots of tumor cell PD-L1 protein staining from one of five tumor-bearing mice. The mean fluorescence intensity of PD-L1 protein was quantified and presented at the top right panel. Column: Mean; Bar: SD. Bottom right panel: RNA was prepared from the tumor tissues and analyzed by real-time PCR for PD-L1 mRNA level. Each dot represents the relative PD-L1 mRNA level from the tumor of one tumor-bearing mouse. (C) RNA was isolated from tumor tissues of tumor-bearing WT (n = 5) and IFNγ KO (n = 5) mice as shown in (A) and analyzed by real-time PCR to determine the levels of Th1/Tc1 cell markers, immune checkpoint molecules, T cells, and T cell effector molecules using the indicated gene-specific PCR primers. Column: Mean; Bar: SD.
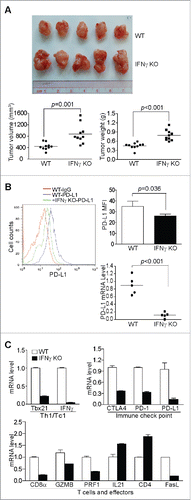
Figure 3. IFNγ is essential for suppression of pancreatic cancer growth in vivo. (A) Tumor cells were transplanted to pancreas of WT (n = 5) and IFNγ KO (n = 5) mice. The orthotopic tumors were dissected from tumor-bearing mice 15 d after tumor transplant. Shown are images of the dissected tumors from one of the two experiments. Tumors from WT (n = 10) and IFNγ KO (n = 10) mice from two experiments were weighed and measured and presented at the bottom panel. (B) Tumor tissues from WT (n = 5) and IFNγ KO (n = 5) mice from one of the two experiments were digested to make single cells and stained with fluorescent dye-conjugated anti-mouse PD-L1 mAb. Shown are the overlay of representative plots of tumor cell PD-L1 protein staining from one of five tumor-bearing mice. The mean fluorescence intensity of PD-L1 protein was quantified and presented at the top right panel. Column: Mean; Bar: SD. Bottom right panel: RNA was prepared from the tumor tissues and analyzed by real-time PCR for PD-L1 mRNA level. Each dot represents the relative PD-L1 mRNA level from the tumor of one tumor-bearing mouse. (C) RNA was isolated from tumor tissues of tumor-bearing WT (n = 5) and IFNγ KO (n = 5) mice as shown in (A) and analyzed by real-time PCR to determine the levels of Th1/Tc1 cell markers, immune checkpoint molecules, T cells, and T cell effector molecules using the indicated gene-specific PCR primers. Column: Mean; Bar: SD.

Figure 4. Ruxolitinib-exerted tumor suppression depends on host IFNγ in vivo. (A) PANC02-H7 cells were orthotopically transplanted to WT mice. The tumor-bearing mice were treated daily from day 6 with IgG isotype control (n = 5,200 μg/mouse) or anti-mouse IFNγ mAb (n = 5,200 μg/mouse) for 10 d. The orthotopic tumors were then dissected from tumor-bearing mice. Shown are the images of the dissected tumors. Tumor volume and weight were quantified and are presented at the bottom. (B) Tumor tissues were digested to make single cells and stained with anti-mouse PD-L1 mAb. Shown is the overlay of representative plots of tumor cell PD-L1 protein staining from one of five tumor-bearing mice of the IgG control and anti-IFNγ mAb treatment groups. The PD-L1 protein MFI was quantified and presented at the top right panel. Column: Mean; Bar: SD. Bottom right panel: RNA was prepared from the tumor tissues and analyzed by the real-time PCR for PD-L1 mRNA level. Each dot represents the relative PD-L1 mRNA level from tumor of one tumor-bearing mouse. (C) RNA was isolated from tumor tissues of tumor-bearing IgG control (n = 5) and anti-IFNγ mAb-treated (n = 5) mice. The gene expression level was analyzed by real-time PCR to determine the levels of Th1/Tc1 cells, immune checkpoint molecules, T cells, and T cell effector molecules using the indicated gene-specific PCR primers. (D) PANC02-H7 cells were orthotopically transplanted to wt mice. The tumor-bearing mice were treated daily from day 6 with IgG isotype control (n = 5), Ruxolitinib (n = 5), anti-mouse IFNγ mAb (n = 5), or Ruxolitinib and anti-mouse IFNγ mAb for 10 d. The orthotopic tumors were then dissected from tumor-bearing mice. Shown are the images of the dissected tumors. Tumor volume and weight were quantified and presented at the right panels.

Figure 4. Ruxolitinib-exerted tumor suppression depends on host IFNγ in vivo. (A) PANC02-H7 cells were orthotopically transplanted to WT mice. The tumor-bearing mice were treated daily from day 6 with IgG isotype control (n = 5,200 μg/mouse) or anti-mouse IFNγ mAb (n = 5,200 μg/mouse) for 10 d. The orthotopic tumors were then dissected from tumor-bearing mice. Shown are the images of the dissected tumors. Tumor volume and weight were quantified and are presented at the bottom. (B) Tumor tissues were digested to make single cells and stained with anti-mouse PD-L1 mAb. Shown is the overlay of representative plots of tumor cell PD-L1 protein staining from one of five tumor-bearing mice of the IgG control and anti-IFNγ mAb treatment groups. The PD-L1 protein MFI was quantified and presented at the top right panel. Column: Mean; Bar: SD. Bottom right panel: RNA was prepared from the tumor tissues and analyzed by the real-time PCR for PD-L1 mRNA level. Each dot represents the relative PD-L1 mRNA level from tumor of one tumor-bearing mouse. (C) RNA was isolated from tumor tissues of tumor-bearing IgG control (n = 5) and anti-IFNγ mAb-treated (n = 5) mice. The gene expression level was analyzed by real-time PCR to determine the levels of Th1/Tc1 cells, immune checkpoint molecules, T cells, and T cell effector molecules using the indicated gene-specific PCR primers. (D) PANC02-H7 cells were orthotopically transplanted to wt mice. The tumor-bearing mice were treated daily from day 6 with IgG isotype control (n = 5), Ruxolitinib (n = 5), anti-mouse IFNγ mAb (n = 5), or Ruxolitinib and anti-mouse IFNγ mAb for 10 d. The orthotopic tumors were then dissected from tumor-bearing mice. Shown are the images of the dissected tumors. Tumor volume and weight were quantified and presented at the right panels.

Figure 5. Inhibition of the JAK-STAT signaling pathway decreases tumor cell PD-L1 expression. (A) Tumor tissues from control and Ruxolitinib-treated tumor-bearing mice were digested to make single cells. Cells were stained with anti-mouse PD-L1 mAb and analyzed by flow cytometry. The top panel shows the overlay of tumor cell PD-L1 staining from one of control and Ruxolitinib-treated tumor-bearing mice. Control-IgG: IgG isotype staining of tumor cells from a control mouse; Control-PD-L1: Anti-PD-L1 mAb staining of tumor cells from a control mouse; +Rux-PD-L1: anti-PD-L1 mAb staining of tumor cells from a Ruxolitinib-treated (+Rux) mouse. The mean fluorescence intensity (MFI) of PD-L1 protein was quantified and presented in the bottom left panel. Column: Mean; Bar: SD. Bottom right panel: RNA was prepared from the tumor tissues of control (n = 4) and Ruxolitinib-treated (n = 4) mice and analyzed by real-time PCR for the PD-L1 mRNA level. Each dot represents the relative PD-L1 mRNA level from tumor of one tumor-bearing mouse. (B) PANC02-H7 cells were cultured in the presence of recombinant IFNγ (100 U/mL) or IFNγ + Ruxolitinib (Rux, 100 nM) for approximately 24 h. Cells were then stained with anti-PD-L1 mAb and analyzed by flow cytometry. The top panel shows the overlay of PD-L1 staining from the control and the indicated treatment groups of tumor cells. The PD-L1 MFI is shown at the bottom left panel. The tumor cells were also analyzed by real-time RT-PCR for the PD-L1 mRNA level (bottom right panel). (C) Tumor cells were treated with recombinant IFNα (100 U/mL) or IFNα and Ruxolitinib (100 nM) for approximately 24 h. Cells were stained with anti-PD-L1 mAb and analyzed by flow cytometry. Left panel shows the overlay of PD-L1 protein staining of the control and the indicated treatment groups of tumor cells. Right panel shows the quantification of PD-L1 protein MFI. (D) Tumor cells were treated with recombinant IFNβ (100 U/mL) or IFNβ and Ruxolitinib (100 nM) for approximately 24 h. Cells were stained with anti-PD-L1 mAb and analyzed by flow cytometry. Left panel shows the overlay of PD-L1 protein staining of the control and indicated treatment groups of tumor cells. Right panel shows PD-L1 protein MFI. (E) Tumor cells were cultured in the presence of IFNγ or IFNγ with Fludarabine (Fluda) at the indicated concentrations for approximately 24 h. Cells were then stained with anti-PD-L1 mAb and analyzed by flow cytometry. Left panel shows the overlay of PD-L1 protein staining of the control and the indicated treatment groups of tumor cells. Right panel shows PD-L1 protein MFI.

Figure 5. Inhibition of the JAK-STAT signaling pathway decreases tumor cell PD-L1 expression. (A) Tumor tissues from control and Ruxolitinib-treated tumor-bearing mice were digested to make single cells. Cells were stained with anti-mouse PD-L1 mAb and analyzed by flow cytometry. The top panel shows the overlay of tumor cell PD-L1 staining from one of control and Ruxolitinib-treated tumor-bearing mice. Control-IgG: IgG isotype staining of tumor cells from a control mouse; Control-PD-L1: Anti-PD-L1 mAb staining of tumor cells from a control mouse; +Rux-PD-L1: anti-PD-L1 mAb staining of tumor cells from a Ruxolitinib-treated (+Rux) mouse. The mean fluorescence intensity (MFI) of PD-L1 protein was quantified and presented in the bottom left panel. Column: Mean; Bar: SD. Bottom right panel: RNA was prepared from the tumor tissues of control (n = 4) and Ruxolitinib-treated (n = 4) mice and analyzed by real-time PCR for the PD-L1 mRNA level. Each dot represents the relative PD-L1 mRNA level from tumor of one tumor-bearing mouse. (B) PANC02-H7 cells were cultured in the presence of recombinant IFNγ (100 U/mL) or IFNγ + Ruxolitinib (Rux, 100 nM) for approximately 24 h. Cells were then stained with anti-PD-L1 mAb and analyzed by flow cytometry. The top panel shows the overlay of PD-L1 staining from the control and the indicated treatment groups of tumor cells. The PD-L1 MFI is shown at the bottom left panel. The tumor cells were also analyzed by real-time RT-PCR for the PD-L1 mRNA level (bottom right panel). (C) Tumor cells were treated with recombinant IFNα (100 U/mL) or IFNα and Ruxolitinib (100 nM) for approximately 24 h. Cells were stained with anti-PD-L1 mAb and analyzed by flow cytometry. Left panel shows the overlay of PD-L1 protein staining of the control and the indicated treatment groups of tumor cells. Right panel shows the quantification of PD-L1 protein MFI. (D) Tumor cells were treated with recombinant IFNβ (100 U/mL) or IFNβ and Ruxolitinib (100 nM) for approximately 24 h. Cells were stained with anti-PD-L1 mAb and analyzed by flow cytometry. Left panel shows the overlay of PD-L1 protein staining of the control and indicated treatment groups of tumor cells. Right panel shows PD-L1 protein MFI. (E) Tumor cells were cultured in the presence of IFNγ or IFNγ with Fludarabine (Fluda) at the indicated concentrations for approximately 24 h. Cells were then stained with anti-PD-L1 mAb and analyzed by flow cytometry. Left panel shows the overlay of PD-L1 protein staining of the control and the indicated treatment groups of tumor cells. Right panel shows PD-L1 protein MFI.

Figure 6. Inhibition of STAT3 activation decreases immune suppressive cytokines in tumor cells to enhance T cell activation. (A) Scheme of modeling functions of STAT3 in T cell and tumor cell interactions in vitro. (B) Tumor cells as treated in (A) were analyzed by Western blotting for STAT3 activation. The protein band intensities were quantified using NIH image J. The pSTAT3 protein level was normalized as the ratio over the intensity of STAT3. Column: Mean; Bar: SD. (C) Tumor cells were either cultured in fresh medium, or T cell-conditioned medium in the absence or presence of pSTAT3 inhibitor STATTIC for 21 h, and then analyzed by qPCR for the indicated cytokines. β-actin was used as internal normalization control. (D) Scheme of modeling STAT3 functions in the effect of T cell-conditioned tumor cells on T cell activation and effector expression. Purified CD3+ T cells were stimulated for 3 d in anti-CD3/CD28-coated plates. Culture supernatant was collected and used to culture tumor cells in the absence or presence of pSTAT3 inhibitor (STATTIC) for 6 h. The medium was then replaced with fresh medium to remove pSTAT3 inhibitor (STATTIC) and the tumor cells were cultured for approximately 15 h. Tumor culture supernatant was then collected and used to culture T cells in anti-CD3/CD28-coated plates. T cells were analyzed after stimulation for 6 h. (E) T cells as treated in (D) were collected and analyzed by qPCR for the expression levels of effectors. The expression level of each effector of unstimulated cells (0 h) was arbitrarily set as 1. β-actin was used as internal control for qPCR. (F) Purified CD3+ T cells were cultured under the conditions as indicated for 3 d and analyzed for proliferation by 3H thymidine incorporation assay and T-bet expression by qPCR. Column: Mean; Bar: SD.

Figure 6. Inhibition of STAT3 activation decreases immune suppressive cytokines in tumor cells to enhance T cell activation. (A) Scheme of modeling functions of STAT3 in T cell and tumor cell interactions in vitro. (B) Tumor cells as treated in (A) were analyzed by Western blotting for STAT3 activation. The protein band intensities were quantified using NIH image J. The pSTAT3 protein level was normalized as the ratio over the intensity of STAT3. Column: Mean; Bar: SD. (C) Tumor cells were either cultured in fresh medium, or T cell-conditioned medium in the absence or presence of pSTAT3 inhibitor STATTIC for 21 h, and then analyzed by qPCR for the indicated cytokines. β-actin was used as internal normalization control. (D) Scheme of modeling STAT3 functions in the effect of T cell-conditioned tumor cells on T cell activation and effector expression. Purified CD3+ T cells were stimulated for 3 d in anti-CD3/CD28-coated plates. Culture supernatant was collected and used to culture tumor cells in the absence or presence of pSTAT3 inhibitor (STATTIC) for 6 h. The medium was then replaced with fresh medium to remove pSTAT3 inhibitor (STATTIC) and the tumor cells were cultured for approximately 15 h. Tumor culture supernatant was then collected and used to culture T cells in anti-CD3/CD28-coated plates. T cells were analyzed after stimulation for 6 h. (E) T cells as treated in (D) were collected and analyzed by qPCR for the expression levels of effectors. The expression level of each effector of unstimulated cells (0 h) was arbitrarily set as 1. β-actin was used as internal control for qPCR. (F) Purified CD3+ T cells were cultured under the conditions as indicated for 3 d and analyzed for proliferation by 3H thymidine incorporation assay and T-bet expression by qPCR. Column: Mean; Bar: SD.

Figure 7. PD-L1 protein and tumor-infiltrating CD8+ T cell levels in human pancreatic carcinoma. Tumor tissue specimens from five human pancreatic cancer patients were stained with antibodies that are specific for human PD-L1 (1a–5a) and human CD8+ (1b–5b), respectively. Brown color indicates PD-L1 protein and tumor-infiltrating CD8+ T cells staining. The tissues were counterstained with hematoxylin. Each image represents representative image of one patient. Red arrows indicate tumor cells and yellow arrows point to tumor-infiltrating CD8+ T cells. (C1) Human Adrenal tumor tissue was used as a positive control for human PD-L1-specific antibody. (C2) Human tonsil tissue was used as a positive control for human CD8+-specific antibody.

Figure 7. PD-L1 protein and tumor-infiltrating CD8+ T cell levels in human pancreatic carcinoma. Tumor tissue specimens from five human pancreatic cancer patients were stained with antibodies that are specific for human PD-L1 (1a–5a) and human CD8+ (1b–5b), respectively. Brown color indicates PD-L1 protein and tumor-infiltrating CD8+ T cells staining. The tissues were counterstained with hematoxylin. Each image represents representative image of one patient. Red arrows indicate tumor cells and yellow arrows point to tumor-infiltrating CD8+ T cells. (C1) Human Adrenal tumor tissue was used as a positive control for human PD-L1-specific antibody. (C2) Human tonsil tissue was used as a positive control for human CD8+-specific antibody.

Figure 8. Ruxolitinib increases the efficacy of anti-PD-1 mAb immunotherapy to suppress pancreatic tumor growth in vivo. (A) PANC02-H7 cells were injected into pancreas to establish orthotopic pancreatic tumors. The tumor-bearing mice were treated with solvent (Control, n = 5), Ruxilitinib (50 mg/kg body weight, n = 5) daily, anti-PD-1 mAb (200 μg/mouse, n = 5) every 2 d, and Ruxolitinib + anti-PD-1 mAb (n = 5) for 10 d. Shown are the images of the dissected tumors. Right panel: tumors were measured using a digital caliber. The tumor volume was calculated by the volume of length × width2/2 (left panel). Tumor weights of the control and treatment groups are presented at the right. (B) RNAs were isolated from tumor tissues of the four group mice as in (A) (n = 5 for each group). The RNA samples from the five mice of each group were pooled and the expression levels of the indicated genes were analyzed by real-time PCR using gene-specific PCR primers. Column: Mean; Bar: SD.

Figure 8. Ruxolitinib increases the efficacy of anti-PD-1 mAb immunotherapy to suppress pancreatic tumor growth in vivo. (A) PANC02-H7 cells were injected into pancreas to establish orthotopic pancreatic tumors. The tumor-bearing mice were treated with solvent (Control, n = 5), Ruxilitinib (50 mg/kg body weight, n = 5) daily, anti-PD-1 mAb (200 μg/mouse, n = 5) every 2 d, and Ruxolitinib + anti-PD-1 mAb (n = 5) for 10 d. Shown are the images of the dissected tumors. Right panel: tumors were measured using a digital caliber. The tumor volume was calculated by the volume of length × width2/2 (left panel). Tumor weights of the control and treatment groups are presented at the right. (B) RNAs were isolated from tumor tissues of the four group mice as in (A) (n = 5 for each group). The RNA samples from the five mice of each group were pooled and the expression levels of the indicated genes were analyzed by real-time PCR using gene-specific PCR primers. Column: Mean; Bar: SD.
Supplemental material

KONI_A_1291106_s02.pdf

Download PDF (564.6 KB)

Reprints and Corporate Permissions

Please note: Selecting permissions does not provide access to the full text of the article, please see our help page How do I view content?

To request a reprint or corporate permissions for this article, please click on the relevant link below:

Academic Permissions

Please note: Selecting permissions does not provide access to the full text of the article, please see our help page How do I view content?

Obtain permissions instantly via Rightslink by clicking on the button below:

If you are unable to obtain permissions via Rightslink, please complete and submit this Permissions form. For more information, please visit our Permissions help page.