1,901
Views
59
CrossRef citations to date
0
Altmetric
Brief Report

PD-L1 and epithelial-mesenchymal transition in circulating tumor cells from non-small cell lung cancer patients: A molecular shield to evade immune system?

, , , , , , , & show all
Article: e1315488 | Received 29 Dec 2016, Accepted 30 Mar 2017, Published online: 11 Oct 2017

Figures & data

Figure 1. In representative images, nuclei are displayed in blue. Pseudo-colors were changed for each of the four channels to optimize the visualization of the different signals. (Panel A) Phenotype of circulating tumor cells (CTCs) in filters obtained by ScreenCell Cyto kit. Hematoxylin and eosin (H&E) stains and immunofluorescence for wide spectrum screening cytokeratin (K), PD-L1, and N-Cadherin (N-Cad). Large (upper) or small (lower) clusters of K+ cells are shown. Subpopulations of K+ cells co-expressing PD-L1 and N-Cad (yellow arrow) and lacking PD-L1 expression (green arrow) are displayed. (Panel B) Immunofluorescence for thyroid transcription factor 1 (TTF1), PD-L1, and Vimentin (VIM) in filters. Clusters of TTF1+ cells (A) and single TTF1+ cells co-expressing PD-L1 and Vimentin. (Panel C) Immunofluorescence for thyroid transcription factor 1 (TTF1) and PD-L1. PD-L1 expression at cytoplasmic/membranous level (empty arrows) and at nuclear level (full arrows) in TTF1+ cells.
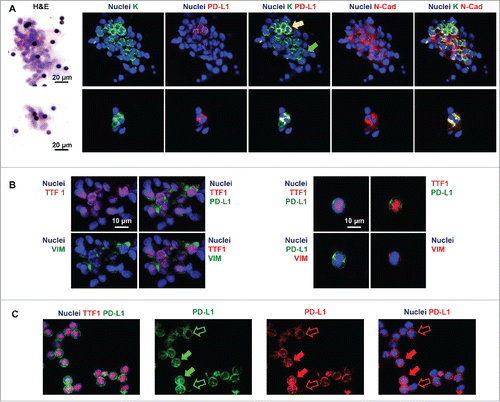
Figure 1. In representative images, nuclei are displayed in blue. Pseudo-colors were changed for each of the four channels to optimize the visualization of the different signals. (Panel A) Phenotype of circulating tumor cells (CTCs) in filters obtained by ScreenCell Cyto kit. Hematoxylin and eosin (H&E) stains and immunofluorescence for wide spectrum screening cytokeratin (K), PD-L1, and N-Cadherin (N-Cad). Large (upper) or small (lower) clusters of K+ cells are shown. Subpopulations of K+ cells co-expressing PD-L1 and N-Cad (yellow arrow) and lacking PD-L1 expression (green arrow) are displayed. (Panel B) Immunofluorescence for thyroid transcription factor 1 (TTF1), PD-L1, and Vimentin (VIM) in filters. Clusters of TTF1+ cells (A) and single TTF1+ cells co-expressing PD-L1 and Vimentin. (Panel C) Immunofluorescence for thyroid transcription factor 1 (TTF1) and PD-L1. PD-L1 expression at cytoplasmic/membranous level (empty arrows) and at nuclear level (full arrows) in TTF1+ cells.

Table 1. Percentage of PD-L1 positive CTCs and of double PD-L1/EMT positive CTCs in patients with NSCLC.

Supplemental material

KONI_A_1315488_s02.pptx

Download MS Power Point (4.5 MB)

Reprints and Corporate Permissions

Please note: Selecting permissions does not provide access to the full text of the article, please see our help page How do I view content?

To request a reprint or corporate permissions for this article, please click on the relevant link below:

Academic Permissions

Please note: Selecting permissions does not provide access to the full text of the article, please see our help page How do I view content?

Obtain permissions instantly via Rightslink by clicking on the button below:

If you are unable to obtain permissions via Rightslink, please complete and submit this Permissions form. For more information, please visit our Permissions help page.