Figures & data
Table 1. Clinical information of 22 kidney cancer patients performed cryoablation
Figure 1. Clonal T cell expansion in post-cryoablation tissues. (A) The distribution of the abundant TCRB CDR3 clonotypes with the read frequency of 1% or higher is presented in pie charts (green color: pre-cryoablation; blue color: post- cryoablation). Gray color indicates portion of CDR3 clonotypes below the read frequency of 1%. (B) The total proportion of the abundant TCRB CDR3 clonotypes with the frequency of 1% or higher was significantly increased in post-cryoablation tissues (p = 0.024). (C) After cryoablation, tissue samples revealed significantly lower TCRB diversity index compared with that in pre-cryoablation (p = 0.021). The Mann—Whitney U test was performed for the comparison of total proportion of the most abundant CDR3 clonotypes (frequency of ≥ 1%) and the diversity index of TCRB between pre- and post-cryoablation.
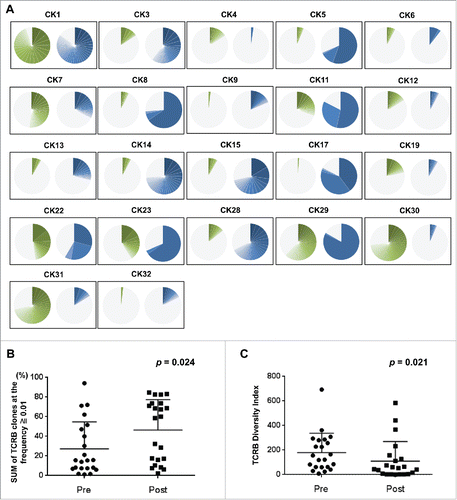
Figure 2. Cryoablation stimulated expansion of unique T cell repertoires in tumor tissues. (A) The 20 most abundant TCRB CDR3 clonotypes newly appeared or drastically increased in the tissues after cryoablation (green bars: clonotypes that were rarely present in pre- cryoablation tissues; red bars: clonotypes that were completely absent in pre-cryoablation tissues; blue bars: 20 most abundant clonotypes observed in post-cryoablation tissues). Figures are from 15 representative cases that revealed a drastic increase of oligoclonal CDR3 sequences in post-cryoablation tissues in . (B) One TCRB CDR3 clonotype was shared in two patients with HLA-A24:02 genotype. Yellow-color bars indicate the identical CDR3 clonotype.
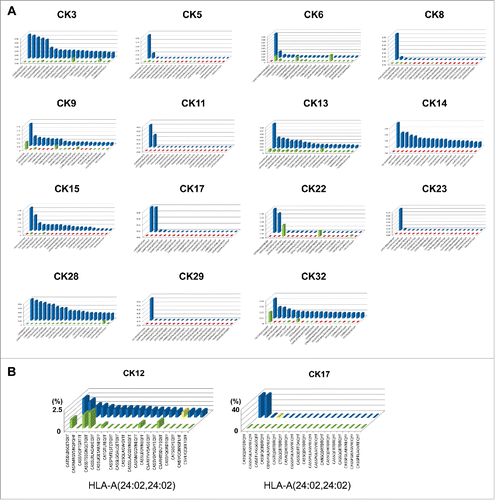
Figure 3. A set of T cell clones identified in both tumor tissues and systemic circulation. Heatmaps showed the distribution of TCRB CDR3 clonotypes in PBMC samples (the top 20 CDR3 clonotypes of post-cryoablation tissue were selected) of five patients who had dominant T cell clones (frequency of ≥ 10%) in post-cryoablation tissues. The asterisks indicate CDR3 clonotypes that were statistically significantly increased at 3 mo post-cryoablation compared with pre-cryoablation samples of PBMC. +, ++ and +++ indicate CDR3 clonotypes that had frequency of 10—20%, 20—30% and more than 30%, respectively.
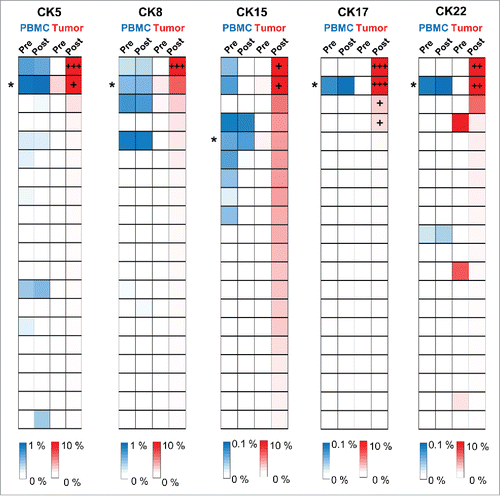
Figure 4. Expression of immune-related genes in tumor tissues. (A) Expression level of each gene was calculated relative to that of GAPDH. The x-axis indicates the ratio of post-cryoablation /pre-cryoablation in the log2 transformed values. *p < 0.01, **p < 0.05 indicates the significant difference by the Mann—Whitney U test. (B) and (C) Correlation analysis between HLA-A and CD8 expression or HLA-DRB1 and CD4 expression in pre-cryoablation tumor tissues. HLA-A and HLA-DRB1 represent one of the major HLA class I and class II molecule, respectively. (D) Correlation analysis between HLA-A expression in pre-cryoablation tumor tissues and the post/pre-cryoablation ratio of the sum of the abundant TCRB CDR3 clonotypes (frequency of ≥ 1%). (E) Comparison of basal HLA-A expression levels in the pre-cryoablation tumor tissues where total proportion of the abundant TCRB CDR3 clonotypes (frequency of ≥ 1%) were decreased (left) or increased (right) by cryoablation.
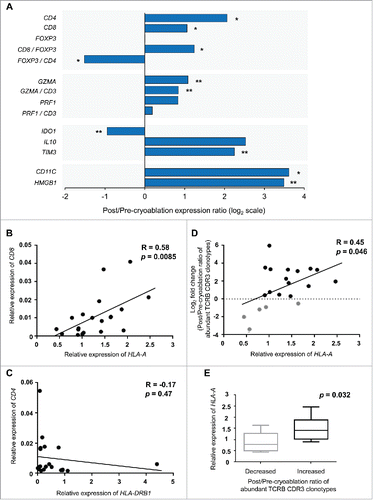
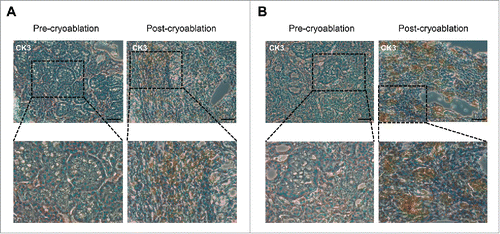
Figure 5. Drastic increase of CD8+ T cells and CD11c+ cells in post-cryoablation tissues. Representative immunohistochemistry results for CD8 (A) and CD11c (B) staining in tumor tissues of case CK3 before and after cryoablation. Magnification: 200 × for upper row, 400 × for lower row. Scale bars = 200 μm.