Figures & data
Figure 1. H3K27M p26–35 vaccination induces mutation-specific CD8+ immune responses in MHC-humanized mice. (A) MHC peptide binding predictions for H3K27M (red bars)-containing and wild type (black bars) 10mer peptides to HLA-A*0201 using NetMHC algorithm. Peptides with binding affinity > 0.3 are defined as potential binders. (B) ELISpots of IFNγ splenocyte responses to H3K27M p26–35 (KM, red dots) or wild type (wt, black dots) after vaccination of A2.DR1 mice with the 10mer H3K27M p26–35 in Montanide®. Numbers of spots to DMSO as negative control were subtracted. Individual values and mean ± SEM of four mice per group and representative ELISpots are shown. (C, D) Intracellular flow cytometry of splenocyte granzyme B (GRANB (C) or Ki-67 (D) responses to H3K27M p26–35 (KM, red dots) or wild type control (wt, black dots) after vaccination of A2.DR1 mice with H3K27M p26–35 in Montanide®. Re-stimulation with the vehicle DMSO served as control, and gate frequencies were subtracted. Gated on living CD3+CD8+ cells. Individual values and mean ± SEM of three mice per group and representative dot plots are shown.
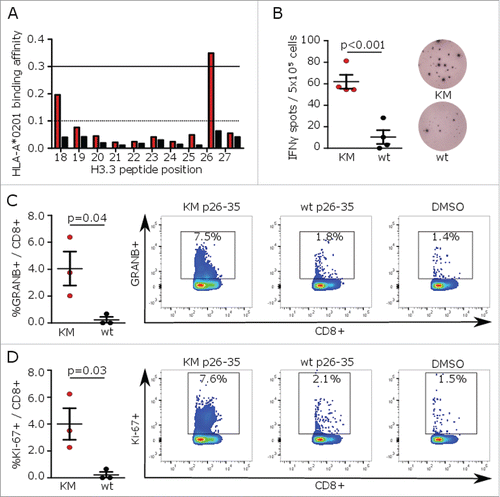
Figure 2. H3K27M p14–40 vaccination induces mutation-specific CD4+ and CD8+ IFNγ immune responses in MHC-humanized mice. (A) ELISpots of IFNγ splenocyte responses to H3K27M p14–40 (KM p14–40, red dots), the wild type control (wt p14–40, black dots), H3K27M p26–35 (KM p26–35, red dots) or the wild type control (wt p26–35, black dots) after vaccination of A2.DR1 mice with the 27mer H3K27M p14–40. (B) ELISpots of IFNγ splenocyte responses to H3K27M p14–40 (KM) in the presence of a pan-HLA class I blocking antibody (ABC), an HLA-DR blocking antibody (DR) or both antibodies after vaccination of A2.DR1 mice with H3K27M p14–40. (C, D) Intracellular flow cytometry of splenocyte CD8+ (C) or CD4+ (D) Ki-67 responses to H3K27M p14–40 (KM) in presence of a pan-HLA class I blocking antibody (ABC), an HLA-DR blocking antibody (DR) or both antibodies after vaccination of A2.DR1 mice with H3K27M p14–40. For ELISpot analyses, the numbers of spots to DMSO as negative control were subtracted. For flow cytometry, re-stimulation with the vehicle DMSO served as control, and gate frequencies were subtracted. Gated on living CD3+CD8+ or living CD3+CD4+ cells, respectively. Individual values and mean ± SEM of three mice per group are shown.
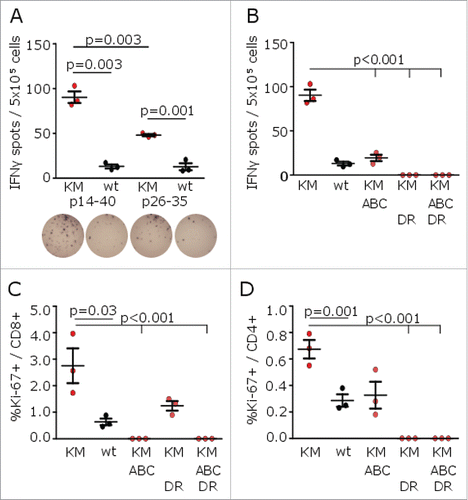
Figure 3. H3K27M peptide vaccination reduces growth of H3K27M+ tumors in MHC-humanized mice. (A) Nuclear H3K27M expression (red) of transduced A2.DR1 sarcoma cells (A2.DR1 H3K27M) or wild type cells (A2.DR1 wt) by immunofluorescent staining using a mutation-specific antibody. Cell nuclei are visualized with DAPI (blue). (B) Growth of pre-established H3K27M over-expressing subcutaneous syngeneic tumors in A2.DR1 mice after peptide vaccination with H3K27M p14–40 (KM p14–40, blue) or vehicle control (black) starting on day 6 (arrow). Mean ± SEM of three mice per group is shown. (C) Intracellular flow cytometry of CD8+ or CD4+ IFNγ responses of tumor-infiltrating lymphocytes (TILs) against H3K27M p14–40 relative to the corresponding wild type control of tumor-bearing A2.DR1 mice after vaccination with H3K27M p14–40 (KM p14–40, blue) or control treated mice (vehicle control, black). Re-stimulation with the vehicle DMSO served as control and gate frequencies were subtracted. Gated on living CD45+CD3+CD8+ or living CD45+CD3+CD4+ cells. Individual values and mean ± SEM of three mice per group are shown.
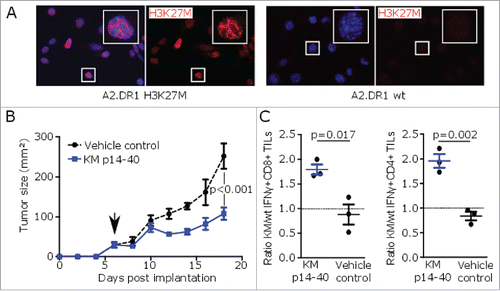
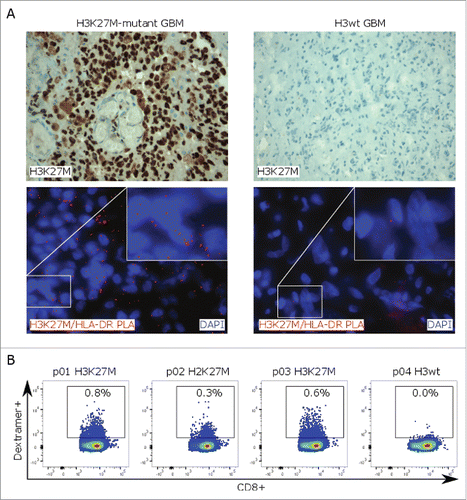
Figure 4. H3K27M-specific T-cell responses in glioma patients. (A)H3K27M staining (upper row) and in situ proximity ligation assay (PLA, lower row) with H3K27M and HLA-DR antibodies (red signal) on H3K27M-mutant or H3 wild type glioma tissue. Cell nuclei are visualized with DAPI (blue). (B) Detection of mutation-specific CD8+ T cells in PBMC samples of glioma patients using a H3K27M p26–35-specific HLA-A*0201 dextramer. PBMCs were analyzed after ex vivo expansion in presence of H3K27M p26–35 and hIL-2 for 9 d. Individual dot plots are shown.