1,526
Views
39
CrossRef citations to date
0
Altmetric
Miata Compliant Research Paper

NK cell dysfunction in chronic lymphocytic leukemia is associated with loss of the mature cells expressing inhibitory killer cell Ig-like receptors

, , , ORCID Icon, , , , , & ORCID Icon show all
Article: e1330235 | Received 13 Dec 2016, Accepted 09 May 2017, Published online: 20 Jun 2017

Figures & data

Figure 1. Increased NK cell counts and changes in surface receptors in CLL patients. (A) NK cells/µL were quantified in whole blood of different donor groups. (B) Correlation between NK cell counts and B cell counts for SLL (open circles) and CLL (filled circles) patients. Vertical and horizontal lines mark the global medians, diagonal line marks a least squares fit analysis, and statistics were calculated with a Spearman test. (C–H) NK cells were gated as viable (propidium iodide-negative), CD45+CD3CD56(dim or bright) and assessed by mean fluorescence intensity (MFI) of staining for expression of (C, D) CD27 or (E, F) NKG2D. For panels (A) and (C–F), filled icons designate monzygotic twins. Horizontal lines designate median values, and statistics were calculated with an unpaired Wilcoxon rank-sum test.
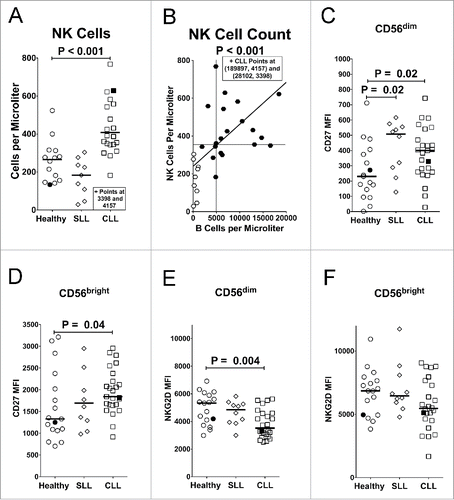
Figure 1. Increased NK cell counts and changes in surface receptors in CLL patients. (A) NK cells/µL were quantified in whole blood of different donor groups. (B) Correlation between NK cell counts and B cell counts for SLL (open circles) and CLL (filled circles) patients. Vertical and horizontal lines mark the global medians, diagonal line marks a least squares fit analysis, and statistics were calculated with a Spearman test. (C–H) NK cells were gated as viable (propidium iodide-negative), CD45+CD3−CD56(dim or bright) and assessed by mean fluorescence intensity (MFI) of staining for expression of (C, D) CD27 or (E, F) NKG2D. For panels (A) and (C–F), filled icons designate monzygotic twins. Horizontal lines designate median values, and statistics were calculated with an unpaired Wilcoxon rank-sum test.

Figure 2. Suppressed degranulation and increased sensitivity to activation-induced cell death (AICD) by NK cells from CLL patients. PBMC were incubated alone, with rituximab (RXB), with 721.221 target cells (721), or with 721.221 targets and RXB for 2 h at 37 °C and stained for (A) Percent LAMP-1 (CD107a) expression or (B) viability (propidium iodide negative). NK cells were gated as CD56dimCD3 after the viability gate in panel (A), and before the viability gate in panel (B) from the same experiments. Filled icons represent monozygotic twins. Horizontal lines mark median values, and statistics were calculated with an unpaired Wilcoxon rank-sum test.
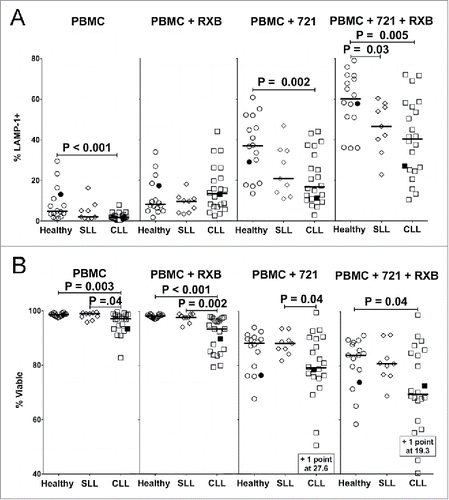
Figure 2. Suppressed degranulation and increased sensitivity to activation-induced cell death (AICD) by NK cells from CLL patients. PBMC were incubated alone, with rituximab (RXB), with 721.221 target cells (721), or with 721.221 targets and RXB for 2 h at 37 °C and stained for (A) Percent LAMP-1 (CD107a) expression or (B) viability (propidium iodide negative). NK cells were gated as CD56dimCD3− after the viability gate in panel (A), and before the viability gate in panel (B) from the same experiments. Filled icons represent monozygotic twins. Horizontal lines mark median values, and statistics were calculated with an unpaired Wilcoxon rank-sum test.

Figure 3. Reduced expression of inhibitory KIR on NK cells in CLL patients is associated with reduced viability of KIR+ cells. Viable CD45+CD3CD56dim NK cells from PBMC of the different donor groups were analyzed by flow cytometry for fraction of cells expressing KIR2DL1 (A) or KIR3DL1 (B). Viability was determined in CD56dim NK cells expressing (+, filled icons) or lacking (-, open icons) KIR2DL1 (C) or KIR3DL1 (D). (E–H) Percentage viability of subsets of CD45+CD3CD56dim NK cells with the indicated KIR2DL1 and KIR3DL1 expression profiles was analyzed by flow cytometry. The viability of NK cells in each quadrant was determined by propidium iodide staining. Data from healthy donors are displayed as circles, SLL patients as diamonds, and CLL patients as squares. Only donors confirmed by genotyping to express the indicated KIR were included in these panels. Horizontal lines indicate median values and statistics were calculated with an unpaired Wilcoxon rank-sum test. Filled icons are from monozygotic twins in panels A, B, and E-H.
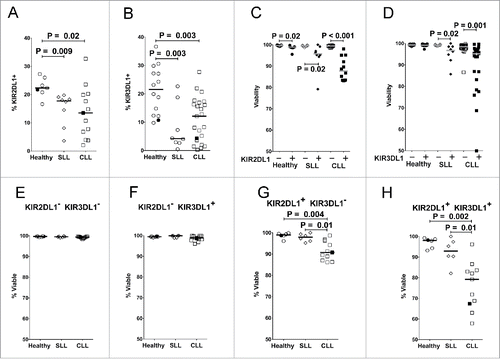
Figure 3. Reduced expression of inhibitory KIR on NK cells in CLL patients is associated with reduced viability of KIR+ cells. Viable CD45+CD3−CD56dim NK cells from PBMC of the different donor groups were analyzed by flow cytometry for fraction of cells expressing KIR2DL1 (A) or KIR3DL1 (B). Viability was determined in CD56dim NK cells expressing (+, filled icons) or lacking (-, open icons) KIR2DL1 (C) or KIR3DL1 (D). (E–H) Percentage viability of subsets of CD45+CD3−CD56dim NK cells with the indicated KIR2DL1 and KIR3DL1 expression profiles was analyzed by flow cytometry. The viability of NK cells in each quadrant was determined by propidium iodide staining. Data from healthy donors are displayed as circles, SLL patients as diamonds, and CLL patients as squares. Only donors confirmed by genotyping to express the indicated KIR were included in these panels. Horizontal lines indicate median values and statistics were calculated with an unpaired Wilcoxon rank-sum test. Filled icons are from monozygotic twins in panels A, B, and E-H.

Figure 4. NK cells expressing inhibitory KIR decline over time in CLL patients. Viable CD45+CD3CD56dim NK cells were analyzed for expression of inhibitory KIR on consecutive blood samples from CLL patients. Lines connect the fraction of NK cells expressing KIR2DL1 (A) or KIR3DL1 (B) from individual donors. KIR2DL1 and KIR3DL1 expression data are only shown from donors confirmed by genotyping. Serial sampling of SLL patients is not shown due to insufficient data points. Horizontal lines designate median values, and statistics were calculated with a paired Wilcoxon rank-sum test, with the initial and subsequent sample from each donor constituting a pair.
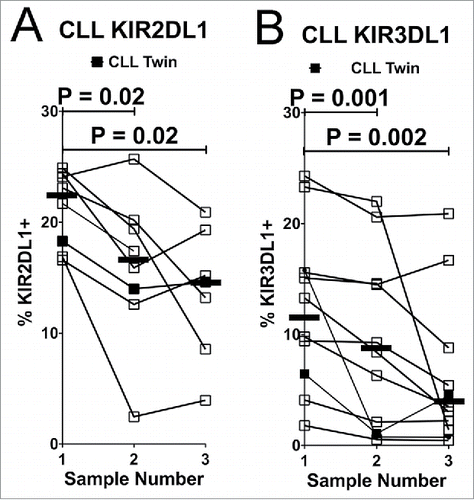
Figure 4. NK cells expressing inhibitory KIR decline over time in CLL patients. Viable CD45+CD3−CD56dim NK cells were analyzed for expression of inhibitory KIR on consecutive blood samples from CLL patients. Lines connect the fraction of NK cells expressing KIR2DL1 (A) or KIR3DL1 (B) from individual donors. KIR2DL1 and KIR3DL1 expression data are only shown from donors confirmed by genotyping. Serial sampling of SLL patients is not shown due to insufficient data points. Horizontal lines designate median values, and statistics were calculated with a paired Wilcoxon rank-sum test, with the initial and subsequent sample from each donor constituting a pair.

Figure 5. Effect of inhibitory KIR ligands on expression of KIR. Healthy donors (H) or CLL patients confirmed by genotyping to express either KIR2DL1 (left) or KIR3DL1 (right) were compared for percent of NK cells (gated as viable, CD45+CD3CD56dim) expressing these KIR (HLA-C2 for KIR2DL1 or HLA-Bw4 for KIR3DL1). Horizontal lines mark the median values, and statistical significance was determined by an unpaired Wilcoxon rank-sum test. Filled icons are from monozygotic twins.
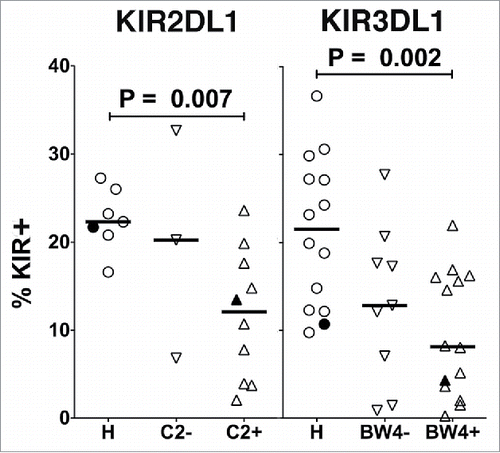
Figure 5. Effect of inhibitory KIR ligands on expression of KIR. Healthy donors (H) or CLL patients confirmed by genotyping to express either KIR2DL1 (left) or KIR3DL1 (right) were compared for percent of NK cells (gated as viable, CD45+CD3−CD56dim) expressing these KIR (HLA-C2 for KIR2DL1 or HLA-Bw4 for KIR3DL1). Horizontal lines mark the median values, and statistical significance was determined by an unpaired Wilcoxon rank-sum test. Filled icons are from monozygotic twins.

Figure 6. NK cells from the healthy monozygotic twin can degranulate when exposed to sibling CLL tumor. Freshly isolated effector NK cells from each twin were challenged with fresh tumor-containing PBMC from the twin with CLL as target cells in degranulation assays. NK cells were partially purified from the CLL patient to achieve similar effector cell concentrations (7.5%), and target PBMC were prestained with CellTracker Blue to gate out of flow cytometry analysis. LAMP-1 (CD107a) expression was subsequently measured on CD56dim NK cells from the (A) CLL and (B) healthy twins. Histogram plots are shown for PBMC alone (shaded), with CLL tumor cells (dashed line), and with CLL tumor cells and rituximab (solid line).
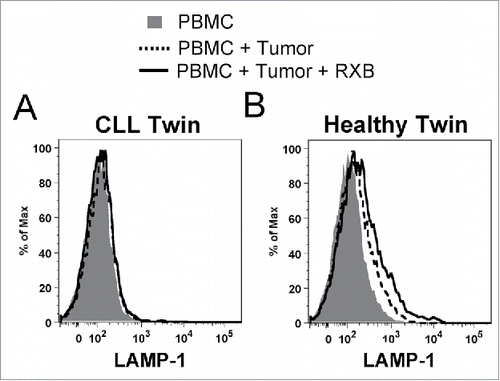
Figure 6. NK cells from the healthy monozygotic twin can degranulate when exposed to sibling CLL tumor. Freshly isolated effector NK cells from each twin were challenged with fresh tumor-containing PBMC from the twin with CLL as target cells in degranulation assays. NK cells were partially purified from the CLL patient to achieve similar effector cell concentrations (7.5%), and target PBMC were prestained with CellTracker Blue to gate out of flow cytometry analysis. LAMP-1 (CD107a) expression was subsequently measured on CD56dim NK cells from the (A) CLL and (B) healthy twins. Histogram plots are shown for PBMC alone (shaded), with CLL tumor cells (dashed line), and with CLL tumor cells and rituximab (solid line).
Supplemental material

KONI_A_1330235_supplementary_data.zip

Download Zip (6.7 MB)

Reprints and Corporate Permissions

Please note: Selecting permissions does not provide access to the full text of the article, please see our help page How do I view content?

To request a reprint or corporate permissions for this article, please click on the relevant link below:

Academic Permissions

Please note: Selecting permissions does not provide access to the full text of the article, please see our help page How do I view content?

Obtain permissions instantly via Rightslink by clicking on the button below:

If you are unable to obtain permissions via Rightslink, please complete and submit this Permissions form. For more information, please visit our Permissions help page.